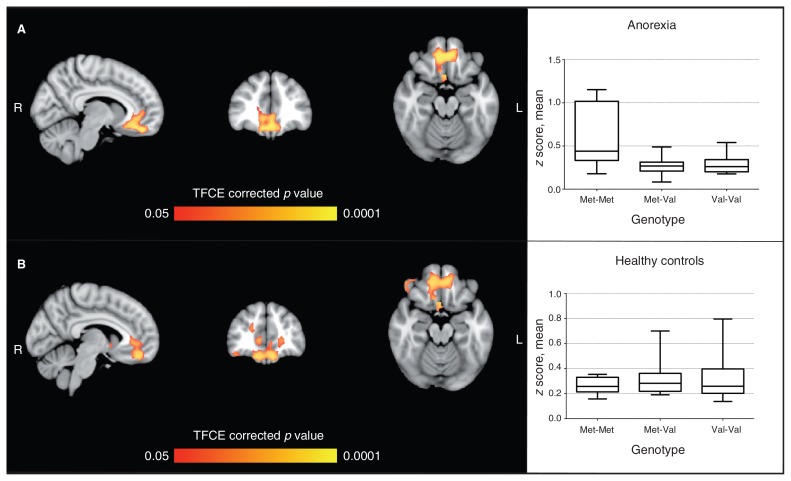
Fig. 2.
Seed-based analysis for the ventromedial prefrontal cortex comparing effects of the catechol-O-methyltransferase enzyme (COMT) genotype in patients with anorexia nervosa and healthy controls. (A) Area of significant genotype × group interaction; peaks: 9, 39, –18 (Brodmann area [BA] 11) and 36, 0, –42 (BA 36). (B) Area of significant difference (p < 0.05, TFCE-corrected) between Met-Met genotype and Val carriers in the anorexia nervosa group (Met-Met > Val); peaks: –6, 45, –18 (BA 11) and 33, –3, –48 (BA 20). Graphs show average coactivation (z score) according to the COMT genotype in patients with anorexia nervosa and healthy controls for the brain areas shown in panel B. No significant effect was found in healthy controls. Analyses were by nonparametric permutation test, with age, education and hand lateralization as covariates. TFCE = threshold-free cluster enhancement.

