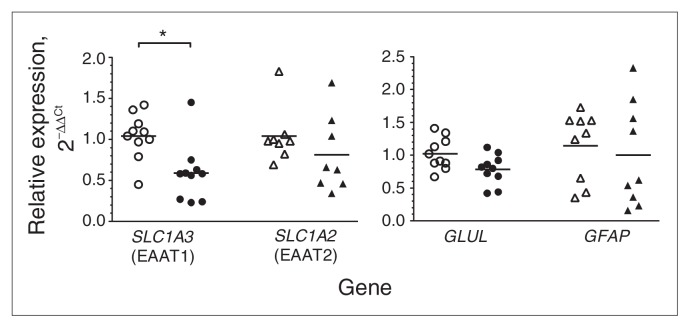
Fig. 1.
Real-time quantitative polymerase chain reaction analysis of SLC1A3 (n = 10), SLC1A2 (n = 9), GLUL (n = 10) and GFAP (n = 9) in punch-dissected locus coeruleus tissue from matched pairs of tissue samples from psychiatrically healthy controls (open symbols) and men with major depressive disorder (closed symbols). Target gene expression was normalized with the geometric mean of 3 reference genes (GAPDH, UBC and ACTB). Relative gene expression levels are shown as fold changes using the method by Livak and Schmittgen.29 *p = 0.001.

