
Fig. 4.
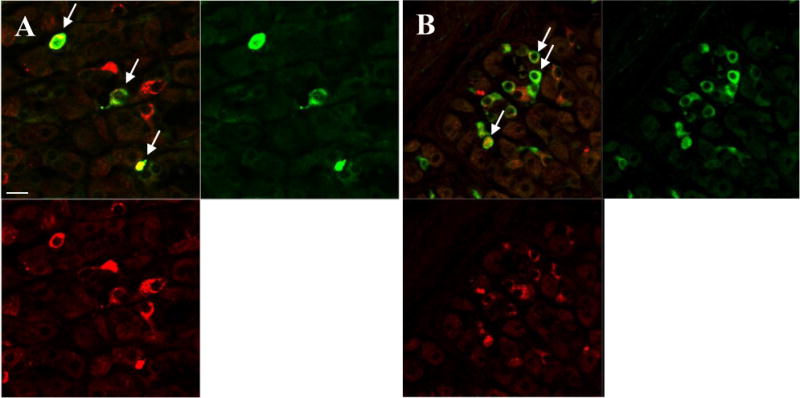
High resolution confocal microscopy of a doubly labeled rat oxyntic mucosal section with anti-GOAT (red) together with anti-ghrelin or anti-HDC antibodies (green). Only half of the GOAT-immunoreactive cells at the mid portion of the glands co-express ghrelin (arrows, A). At the base, approximately half of the GOAT-positive cells co-localize with HDC, a marker for ECL cells (arrows, B). The scale bar represents 10 μm.