Figure 4.
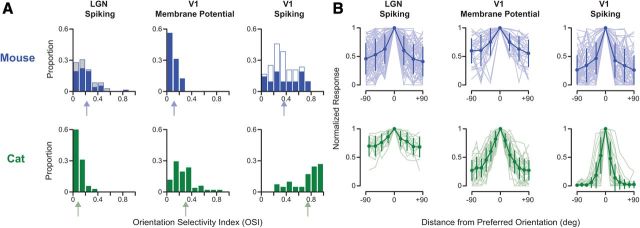
Comparison of orientation selectivity in mouse and cat. A, Distributions of OSI in mouse (blue) and cat (green) LGN spiking responses, V1 subthreshold membrane potential responses, and V1 spiking responses. Arrows indicate mean value for each distribution. V1 spiking OSI is based on the suprathreshold responses from intracellular records. Measurements made during cortical inactivation shown for mouse (gray). In mouse V1, some of the spiking OSI measurements were based on extracellular single-unit records (open blue). OSI distributions in mouse LGN and V1 subthreshold input are similar, whereas those in the cat show an enhancement of selectivity. In V1 of both mouse and cat, there is an enhancement of selectivity from subthreshold to spiking responses. B, Orientation tuning curves centered around preferred orientation (±90°) are shown across the visual pathway in mouse (blue) and cat (green). Each tuning curve was normalized by the peak response at the preferred orientation. Mean and SD are plotted over each population (light shading). Note that tuning curves shown for the cat LGN are from a subset of neurons (n = 13/35) for which we measured responses with small angle increments.

