Figure 2.
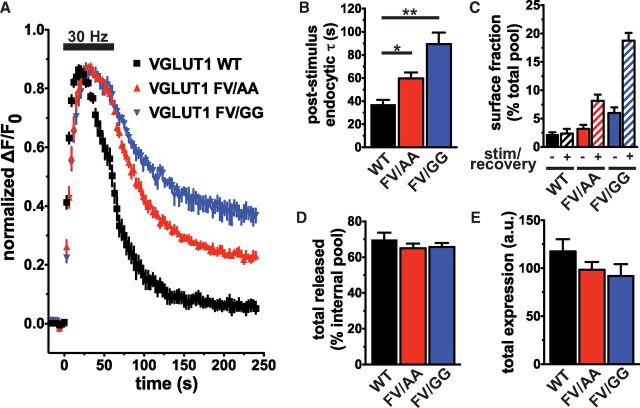
Mutation of the C-terminal dileucine-like motif slows, but does not eliminate VGLUT1 endocytosis. A, Time course of changes in fluorescence intensity (ΔF/F0) in hippocampal neurons transfected with WT VGLUT1-pH (black), FV/AA VGLUT1-pH (red), or FV/GG VGLUT1-pH (blue). The traces, normalized to peak fluorescence, exhibit increases during stimulation at 30 Hz for 1 min (bar) and decreases after stimulation, consistent with exocytosis followed by endocytosis. Endocytosis of FV/GG VGLUT1-pH is less efficient than either WT or FV/AA. B, The mean poststimulus fluorescence decay, fit to a single exponential, is significantly faster for WT (36.9 ± 4.3 s) than FV/AA (59.8 ± 5.0 s; *p < 0.05) or FV/GG (89.4 ± 10.0 s; **p < 0.001, one-way ANOVA, Tukey's post-test). C, The fraction of VGLUT1-pH present on the cell surface at steady-state before stimulation (solid bars; stim/recovery −) and 3 min after stimulation (striped bars; stim/recovery +) was estimated by subtracting the fluorescence upon acid quenching with Tyrode's solution containing MES, pH 5.5, from the fluorescence at rest, normalized to total fluorescence upon alkalinization with NH4Cl. The steady-state surface level of the FV/GG mutant (6.0 ± 1.0%) is significantly higher than both the FV/AA mutant (3.2 ± 0.7%; p < 0.05, one-way ANOVA, Tukey's post-test) and WT (2.2 ± 0.4%; p < 0.01, one-way ANOVA, Tukey's post-test). Fluorescence after recovery from stimulation of both FV/AA (8.2 ± 1.1%) and FV/GG (18.8 ± 1.4%) mutants are significantly higher than WT (2.3 ± 0.9%; WT vs FV/AA, p < 0.01; WT vs FV/GG, p < 0.001; one-way ANOVA, Tukey's post-test). D, The total amount of transporter released by stimulation at 30 Hz for 1 min was determined in the presence of bafilomycin. The fraction of the total internal pool released is similar between WT (69.6 ± 4.1%), FV/AA (65.0 ± 2.6%), and FV/GG (65.8 ± 2.2%) VGLUT1-pH (p = 0.55, one-way ANOVA). The total internal pool was determined by subtraction of the initial fluorescence from the total fluorescence, as measured by application of 50 mm NH4Cl. E, Total protein expression of WT (117.7 ± 12.7 a.u.), FV/AA (98.7 ± 7.9 a.u.), and FV/GG (92.1 ± 12.2 a.u.) VGLUT1-pH at boutons are not significantly different (p = 0.26, one-way ANOVA). Data are the mean ± SEM of at least 20 boutons per coverslip from 5–10 coverslips from at least two independent cultures.

