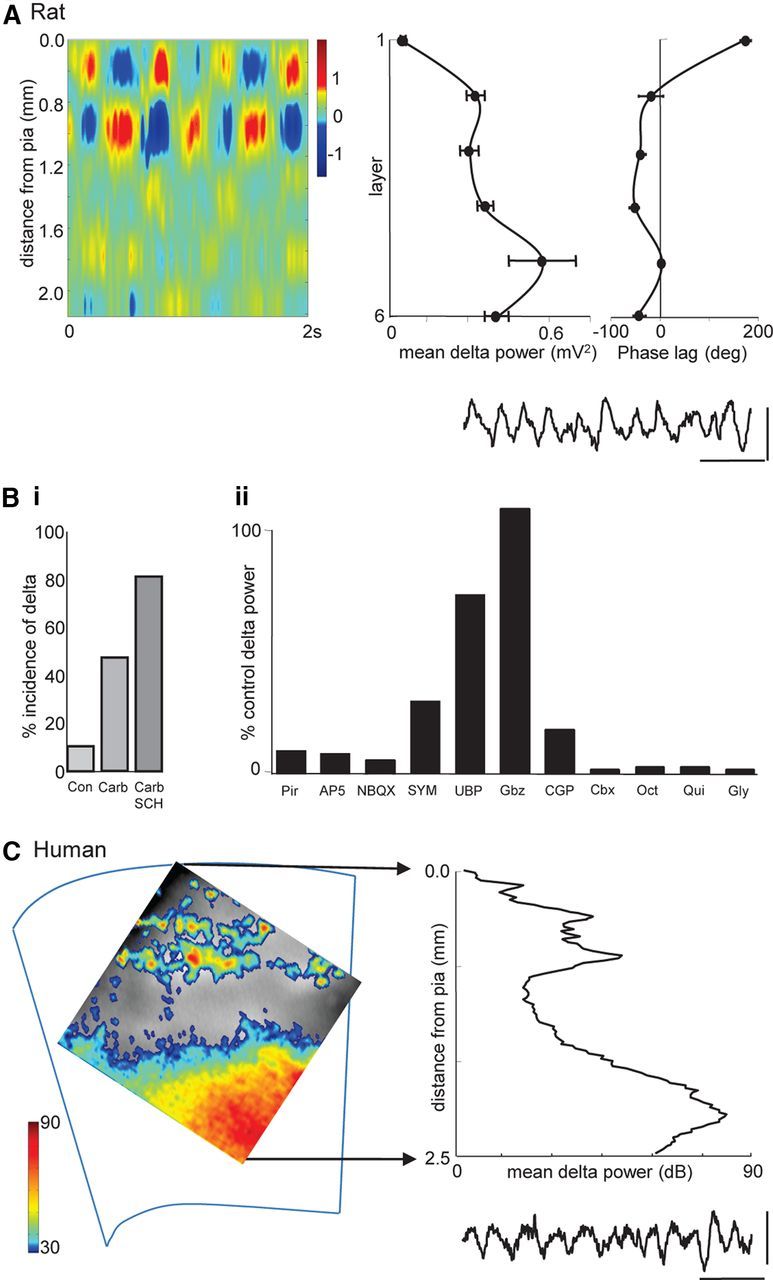
Figure 1.

Basic properties of neocortical delta rhythms in vitro in human and rat tissue. A, Linear electrode array recording of persistent, spontaneous delta rhythms in rat parietal cortex. Image shows a 2 s epoch of delta activity as current source density plot. Note the superficial dominance of sink/source pairs. Graphs show mean delta power (n = 5, with 5 × 20 s epochs per n) and laminar phase difference relative to layer 5. Note the power maxima in layer 5 (as seen in human recordings in C) and the abrupt phase reversal between layers 1 and 2/3. Example trace taken from an electrode located in layer 5. Calibration: 0.3 mV, 1 s. B, Pharmacological profile of delta activity. i, Incidence of spontaneous delta generation with neuromodulation. Con, Control; Carb, carbachol, 2 μm; SCH, SCH23390, 10 μm. ii, Changes in mean delta power (n = 5) after application of drugs affecting various network mechanisms: pirenzipine (Pir, 10 μm) M1/M3 blockade, AP-5 (50 μm) NMDAR blockade, NBQX (20 μm) AMPA/kainate receptor blockade, SYM2206 (SYM, 10 μm) AMPAR blockade, UBP302 (UBP, 20 μm) GluR5 kainate receptor blockade, gabazine (Gbz, 500 nm) GABAA receptor blockade, CGP55845 (CGP, 1 μm) GABAB receptor blockade, and gap junction conductance decrease [carbenoxolone (Cbx, 0.2 mm), octanol (Oct, 1 mm), quinine (Qui, 0.2 mm), and 18β-glycyrrhetinic acid (Gly, 0.1 mm)]. C, Voltage-sensitive dye imaging of persistent, spontaneous delta rhythms in human frontal cortex. Image shows delta power averaged over 5 × 20 s epochs. Color map adjusted to show delta power hard-thresholded at 30 dB. Graph shows mean laminar distribution of delta power indicating maxima in layers 5/6 and 2/3. Example trace shows a 2 × 2 pixel binned time series of the raw fluorescence change. Calibration: 0.02% δF/F, 1 s.
