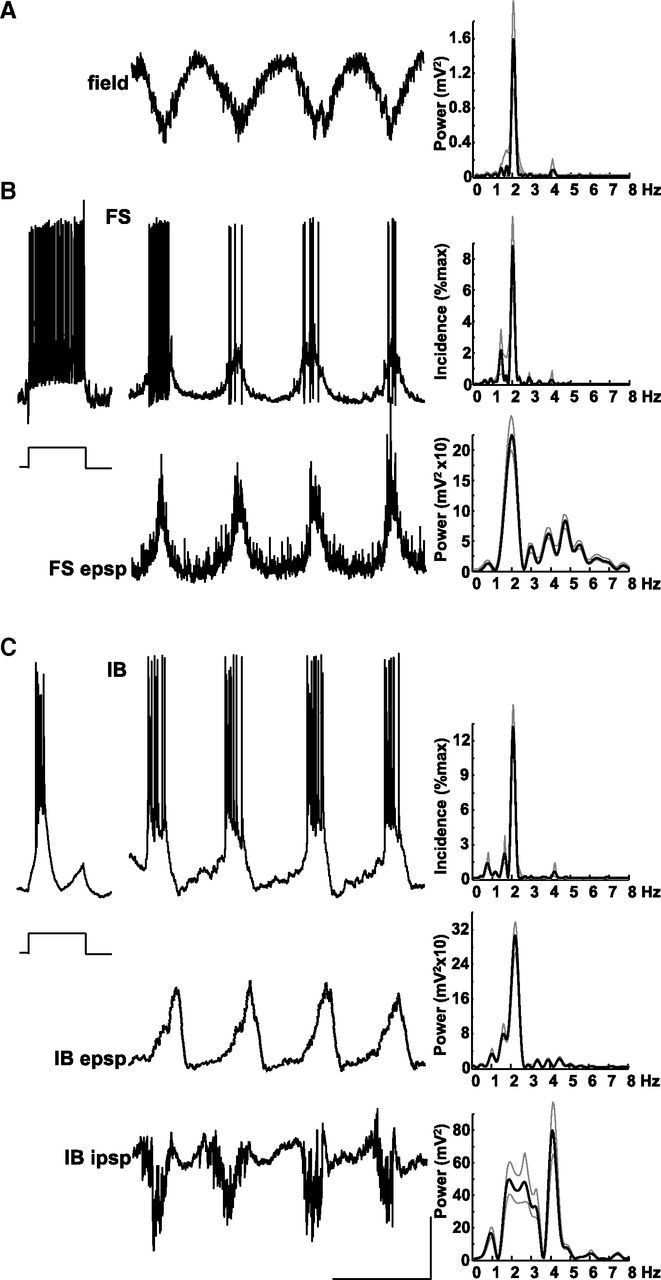
Figure 2.

Delta rhythms are generated by layer 5 IB neurons. A, Example trace showing a layer 5 LFP recording of delta activity. Spectrum shows a tight, single modal peak at ∼2 Hz. Data plotted as mean (black line) and SEM (gray lines). B, Example recordings from a non-accommodating, FS interneuron in layer 5. Response to step injection of +0.2 nA current for 200 ms demonstrates the intrinsic spiking behavior. Top trace shows spontaneous bursts of spike generation at resting membrane potential phase locked to the concurrently recorded field (A). Top histogram shows mean burst incidence at delta frequency. Bottom trace shows membrane potential at −70 mV (mean) revealing large, slow, regular depolarizations interspersed with more rapid but smaller, faster EPSPs. Bottom spectrogram shows that mean power of EPSPs onto FS cells had a modal peak at delta frequency but with a smaller additional peak in the theta (∼5 Hz) band. C, Example recordings from an IB neuron in layer 5. Step depolarization with 0.2 nA (200 ms) reveals the intrinsic bursting behavior of this cell type. Top trace shows spontaneous bursts of spike generation at resting membrane potential phase locked to the layer 5 field delta rhythm (note that these traces were not concurrently recorded with the example field in A). Top histogram demonstrates mean burst incidence at delta frequency. Middle trace shows a recording from the same neuron held at −70 mV (mean) revealing large, ramped EPSPs underlying the bursting behavior. Mean power spectra again show peak incidence of EPSPs at delta frequency. Bottom trace shows activity in the same cell held at −30 mV to reveal IPSP inputs. IPSPs were complex, consisting of delta-frequency bursts of higher frequency, fast IPSPs interleaved with single, slow hyperpolarizations. Mean spectra (bottom graph) of such behavior in n = 5 neurons exposed a bimodal power distribution with peaks at delta and theta frequencies. Calibration: 200 mV (field), 20 mV (resting membrane potential), 10 mV (−70 and −30 mV recordings), 0.5 s.
