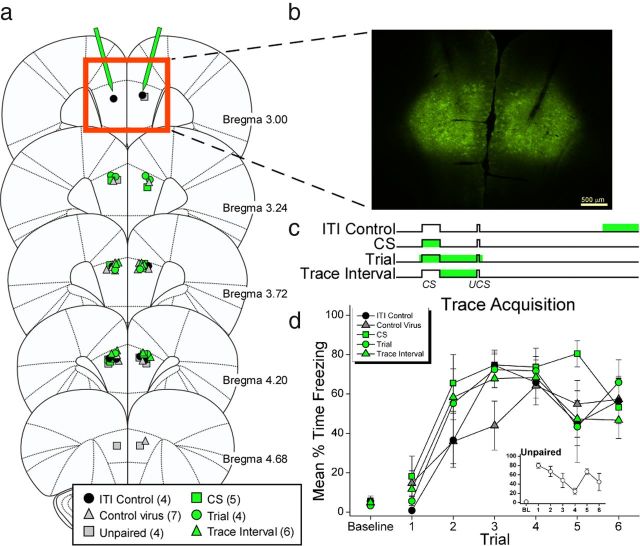
Figure 2.
Temporally specific silencing of PL mPFC during conditioning. a, Coronal diagrams show the placement of fiber tips in PL for each rat. b, ArchT expression in PL mPFC and location of bilateral fiber cannulae in PL. c, Procedure diagram of light delivery (green bar) for each training group during conditioning. d, Mean freezing during the training session of TFC. Each point shows the freezing during each trial (10 s CS and 20 s trace interval). For the Trial, CS, and Trace Interval groups, the laser was on for all or part (CS group) of this period. The unpaired group received the first CS trial after two UCS trials. Freezing during each of the six CS trials is shown in the inset. All groups, including unpaired, showed equivalent freezing on the final trial (F(5,24) = 0.321, p = 0.895). Coronal diagrams were adapted from Paxinos and Watson, 2007, with permission from Elsevier.

