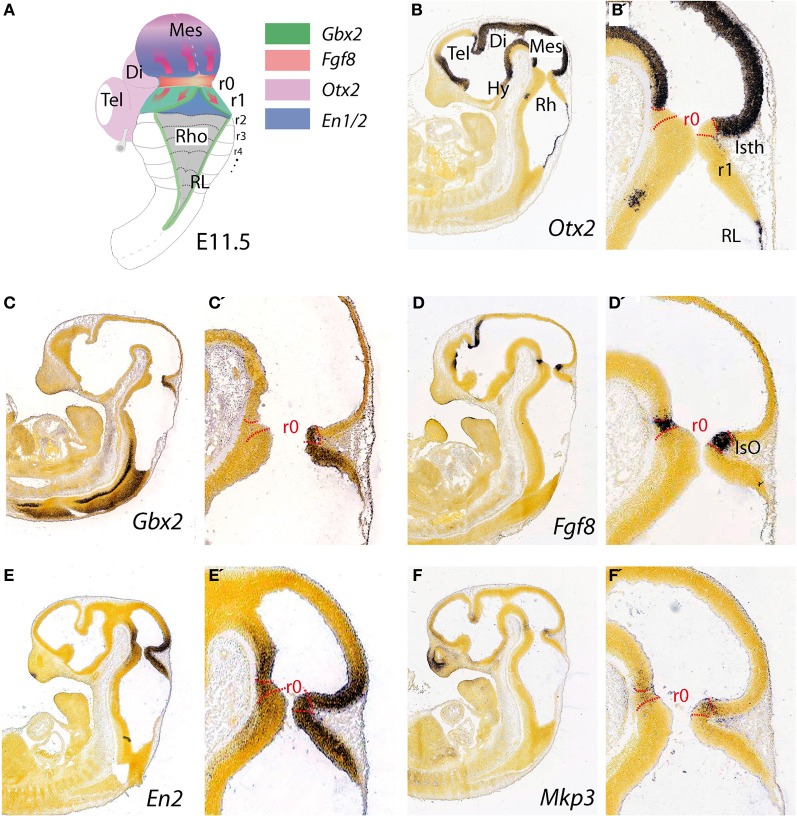
Figure 1.
Topographical location and main molecular characterization of the mid-hindbrain boundary at E11.5. (A) A dorsal view of an E11.5 mouse embryo illustrating the isthmic constriction (isth) located between the mesencephalon and rhombomere 1 (r1). Moreover, rhombomeres, r0 and r1, which give rise to the cerebellum are highlighted in (A). The different color codes depict the expression pattern of the most important genes related to the morphogenetic activity and the capacity of the IsO (We only consider Fgf8-positive territory at this constriction as IsO; see also Martínez, 2001). Expression patterns of genes that are illustrated in (A) and their boundaries are also shown by in situ hybridization (ISH) at E11.5 for Otx2 (B,B′), Gbx2 (C,C′), Fgf8 (D,D′) En2 (E,E′), and Mkp3 (F,F′). Panels (B–F′) were taken from Allen Institute for Brain Science public resources (http://www.brain-map.org/).

