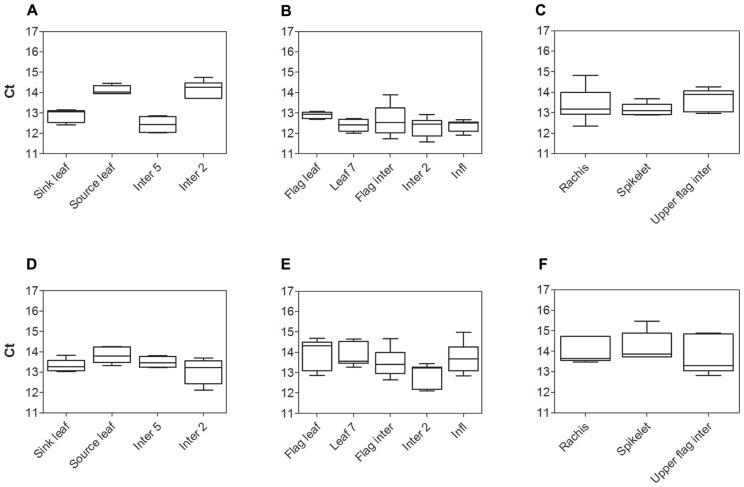
FIGURE 1.
Analysis of Sorghum housekeeping gene SbEF-1α expression, by qPCR. Cycle threshold (Ct) values for the Sorghum SbEF-1α gene in cv. Rio (A–C) and cv. BTx623 (D–F) during vegetative growth (A,D), at anthesis (B, E), and within the upper flag internode and inflorescence components at anthesis (C, F). Box and whisker plots represent minimum to maximum Ct value, with upper and lower quartile from five biological replicates.

