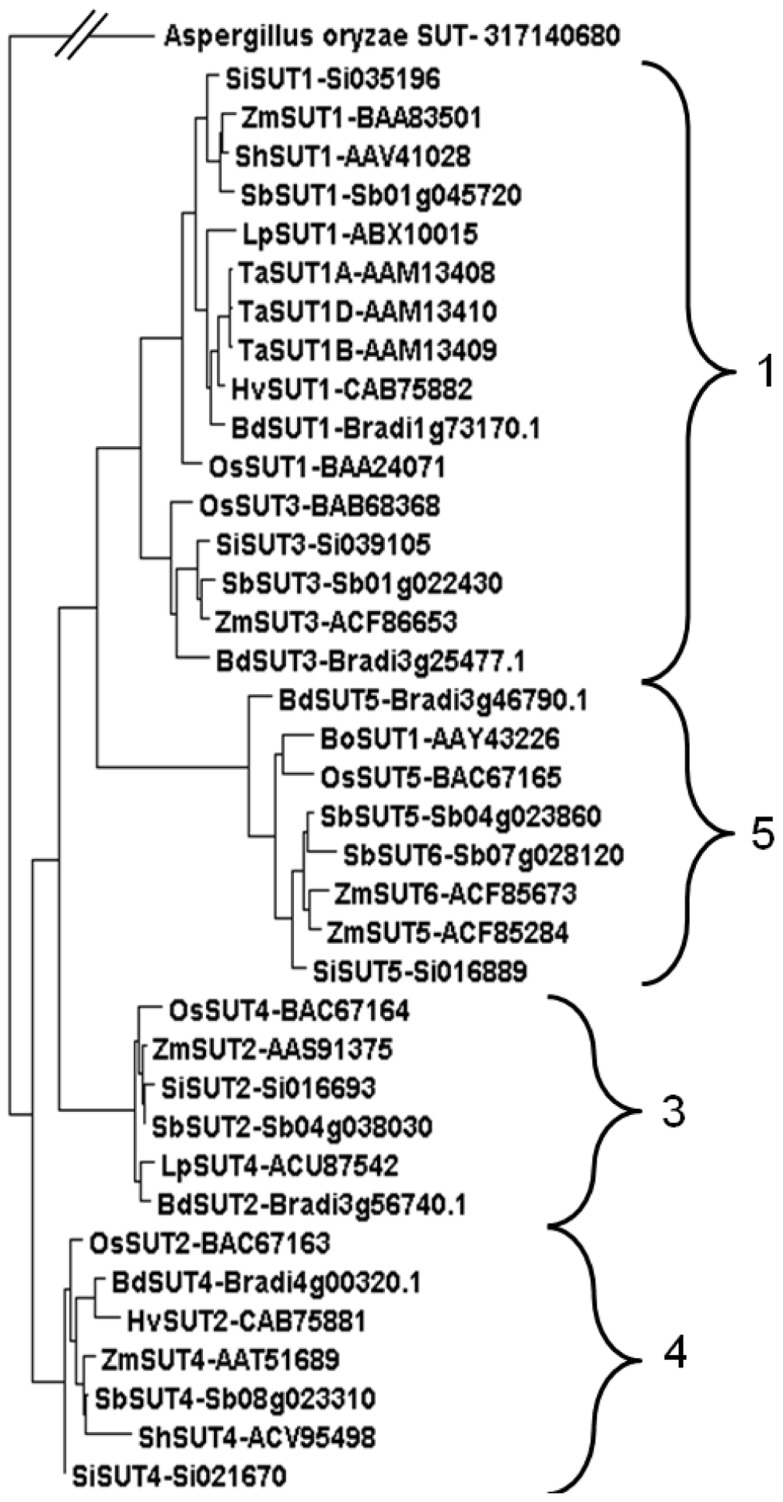
FIGURE 3.
Phylogenetic analysis of SUTs from monocotyledonous species. SUTs displayed fit into Groups 1, 3, 4, 5 (Braun and Slewinski, 2009) from species Brachypodium distachyon* (BdSUT1, BdSUT2, BdSUT3, BdSUT4, BdSUT5), Bambusa oldhamii (BoSUT1), Hordeum vulgare (HvSUT1, HvSUT2), Lolium perenne (LpSUT1, LpSUT4), Oryza sativa* (OsSUT1, OsSUT2, OsSUT3, OsSUT4, OsSUT5), Saccharum hybrid (ShSUT1, ShSUT4), Setaria italica* (SiSUT1, SiSUT2, SiSUT3, SiSUT4, SiSUT5), Sorghum bicolor* (SbSUT1 – Sb01g045720, SbSUT2 – Sb04g038030, SbSUT3 – Sb01g022430, SbSUT4 – Sb08g023310, SbSUT5 – Sb04g023860, SbSUT6 – Sb07g028120), Triticum aestivum (TaSUT1A, TaSUT1B, TaSUT1D), Zea mays* (ZmSUT1, ZmSUT2, ZmSUT3, ZmSUT4, ZmSUT5, ZmSUT6). Phylogenetic analysis was carried out using MUSCLE alignment, Gblocks curation followed by PhyML phylogeny (Dereeper et al., 2008) before viewing in Dendroscope (Huson et al., 2007). Accession numbers are shown along with gene identifications (Brachypodium, Setaria, and Sorghum). Asterisks indicate that the full genomic sequence is publicly available.

