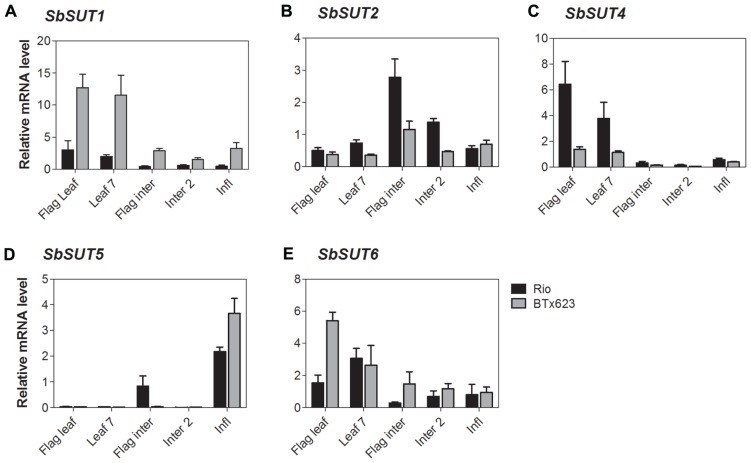
FIGURE 6.
Sorghum SUT transcript levels at anthesis.Relative expression at anthesis of Sorghum SUTs (A) SbSUT1; (B) SbSUT2; (C) SbSUT4; (D) SbSUT5; (E) SbSUT6. Levels of SUT expression were measured relative to SbEF-1α. Organs examined were the Flag leaf; Leaf 7; flag internode (Flag inter); Internode 2 (Inter 2) and the inflorescence (Infl). Columns with vertical bars represent mean ± SE from five biological replicates.

