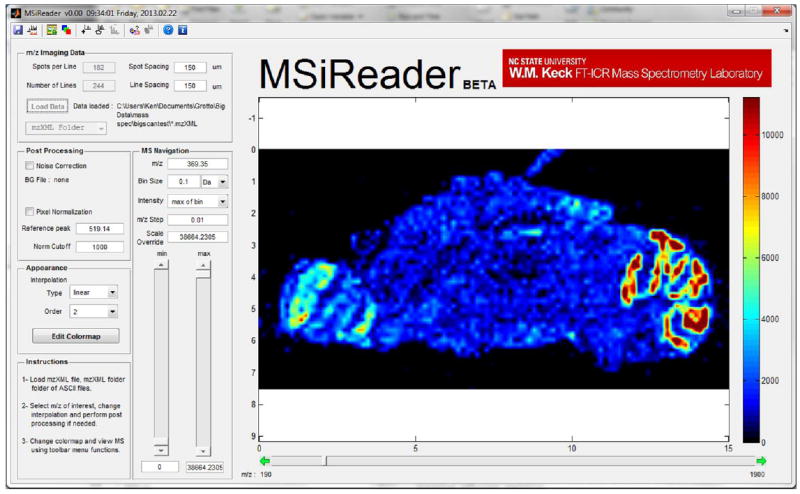
Figure 2.

MSiReader user friendly interface. User can choose among several different color scales and adjust intensity using scrollbars. Another scrollbar can be used to navigate through the imaging file or the m/z value can be entered directly as input. All other data analysis features can be accessed in left panel or in toolbar menu.
