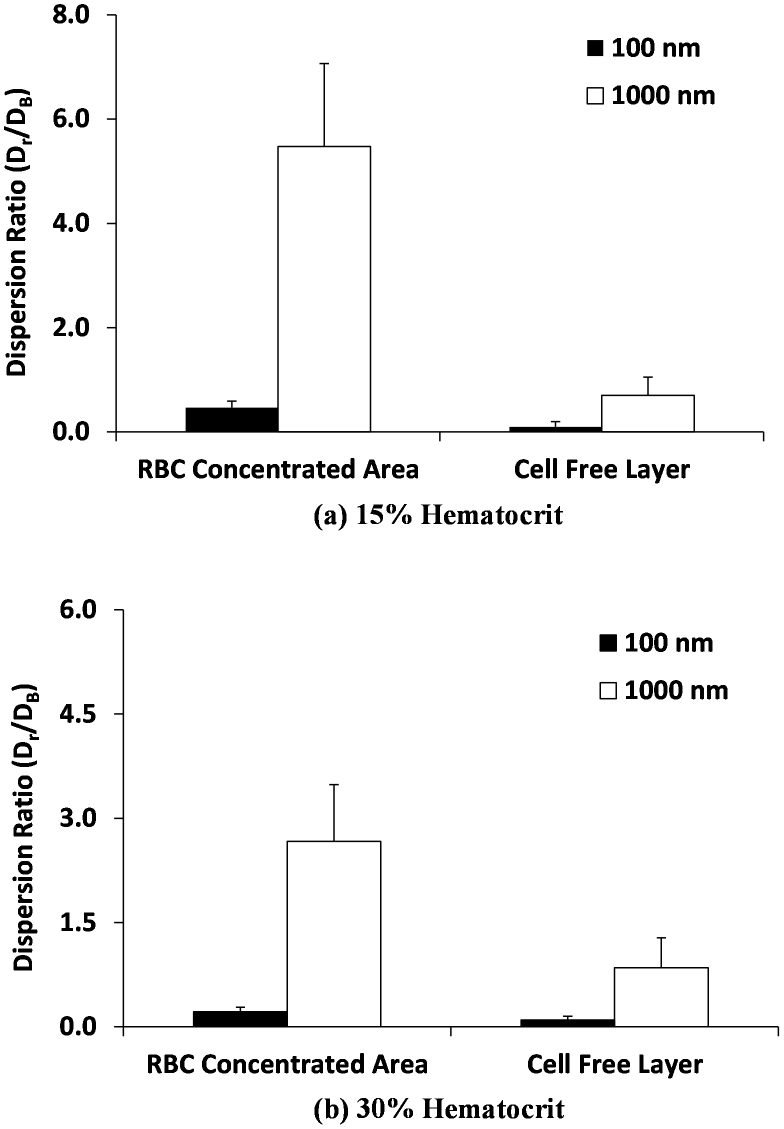
Figure 6. Radial dispersion coefficient Dr of the NMPs.
The radial dispersion coefficient is presented for the 100 nm and 1,000 nm NMPs at two different hematocrit values, namely (a) 15% and (b) 30%. Data are presented as absolute dispersion coefficient divided by the corresponding Brownian diffusion coefficient.

