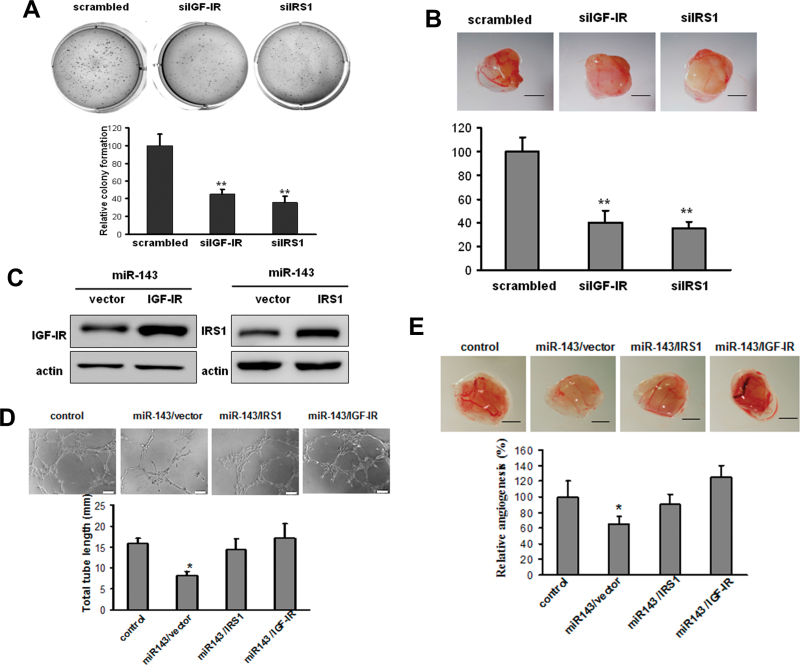
Fig. 4.
miR-143 attenuates tumor angiogenesis by directly targeting IGF-IR/IRS1. (A and B) BEAS-Cr cells were transfected with 50nM of an siRNA scramble control or siRNA SMARTpool against IGF-IR and IRS1, respectively, for 24 h and were subjected to soft agar assay (A) or CAM assay (B) as previously described. Scale bar: 2mm. ** indicates significant difference compared with control group (p < 0.01). (C) BEAS-Cr cells stably expressing miR-143 were established as described in Figure 2. Retrovirus carrying IGF-IR or IRS1 cDNA was used to generate stable BEAS-Cr cells overexpressing miR-143/vector, miR-143/IGF-IR, or miR-143/IRS1. (D) Tube formation assay was performed as described in Figure 2A. Conditioned medium was prepared from BEAS-Cr miR-cont cells, BEAS-Cr miR-143 cells, BEAS-Cr miR-143/IGF-IR cells, and BEAS-Cr miR-143/IRS1 cells, respectively. Total tube lengths for each treatment were analyzed and presented as mean ± SE (mm) from six replicates for each treatment. (E) BEAS-Cr miR-cont cells, BEAS-Cr miR-143 cells, BEAS-Cr miR-143/IGF-IR cells, or BEAS-Cr miR-143/IRS1 cells were implanted onto the CAMs to perform angiogenesis assay as described in Figure 2B. The representative images from each group were shown here. Scale bar: 2mm. The total number of blood vessels in each group was quantified. * and # indicate significant difference compared with miR control and with miR-143 cells, respectively.

