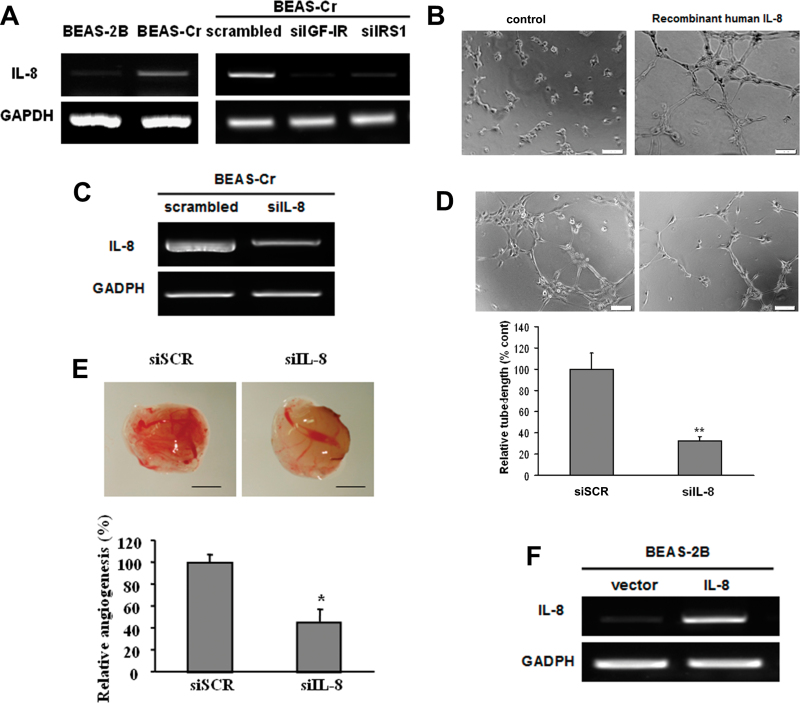
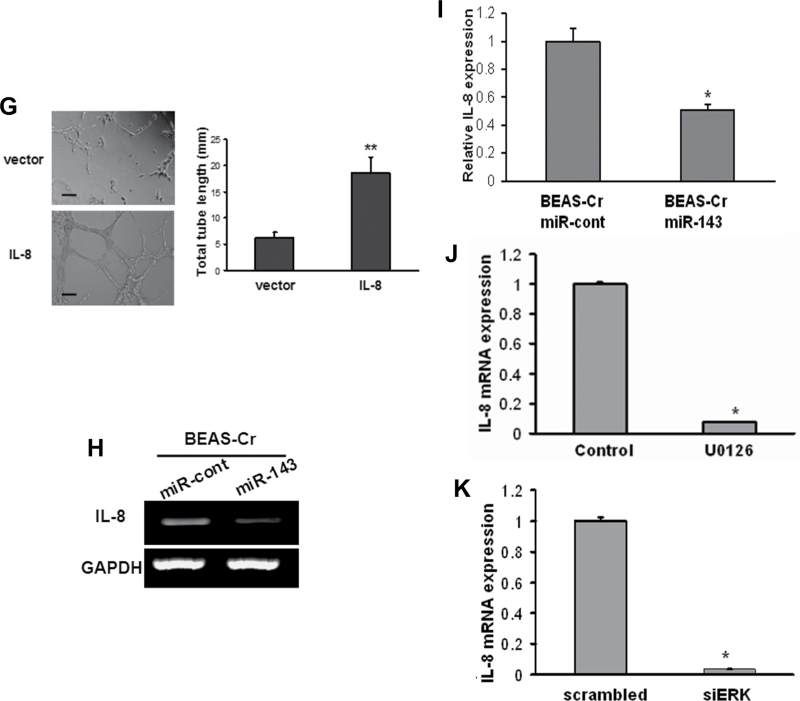
Fig. 6.
IL-8 mediates Cr (VI)–induced angiogenesis via IGF-IR/IRS1/ERK signaling. (A) Left panel: RT-PCR analysis was used to evaluate mRNA levels of IL-8 in BEAS-Cr cells and control BEAS-2B cells. Right panel: BEAS-Cr cells were transfected with 50nM of an siRNA scramble control or an siRNA SMARTpool against IGF-IR or IRS1 for 60h. Total RNA samples were prepared and subjected to RT-PCR analysis for IL-8 expression. (B) HUVECs were cultured in Matrigel-coated 96-well plate in basic medium or medium containing 10ng/ml recombinant human IL-8. Tube formation was photographed 6h after the seeding. (C and D) Conditioned media were prepared from BEAS-Cr cells transfected with siRNA control and siIL-8. HUVECs were cultured in conditioned medium. Tube formation was assessed as previously described. (E) BEAS-Cr cells were transfected with 50nM of an siRNA scramble control or a SMARTpool siRNA against IL-8 for 24h. Then, the cells were subjected to CAM assay as described. (F) Establishment of BEAS-2B cells stably expressing IL-8. (G) Tube formation assay was performed using conditioned media prepared from BEAS-2B empty vector cells and BEAS-2B overexpressing IL-8 cells. Scale bar: 100 μm. Data were presented as mean ± SE (n = 6). (H) BEAS-Cr cells were transfected with miR-143 or miR control precursor for 60h. Total RNA samples were prepared for detection of IL-8 expression levels. (I) BEAS-Cr cells were transfected with miR-143 or miR control precursor for 60h. The SYBR-Green RT-qPCR analysis was performed to detect IL-8 mRNA levels. (J) BEAS-Cr cells were treated with or without ERK inhibitor U0126 (5μM) for 24h. Total RNAs were extracted and used to determine IL-8 mRNA levels. (K) BEAS-Cr cells were transfected with siMAPK (50nM) or scrambled siRNA (50nM). Total RNAs were extracted 60h after transfection to detect IL-8 mRNA levels by RT-qPCR. ** indicates significant difference compared with control group (p < 0.01). All experiments were performed in triplicate and presented as mean ± SE. * indicates significant difference compared with control group (p < 0.05).


