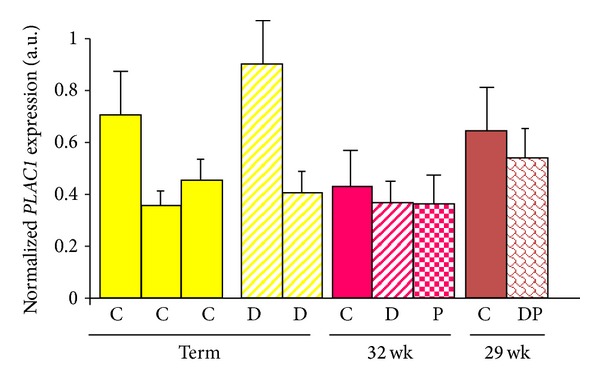
Figure 1.

PLAC1 mRNA expression in placentae associated with normal and abnormal pregnancies. PLAC1 mRNA expression was measured by quantitative, real-time PCR and normalized to 18S ribosomal RNA. Each bar represents the mean + SD (standard deviation) of triplicate samples obtained from a single placenta. Each sample was run in triplicate. C = normal pregnancy; D = maternal diabetes; P = preeclampsia; DP = presence of both diabetes and preeclampsia.
