
Figure 7.
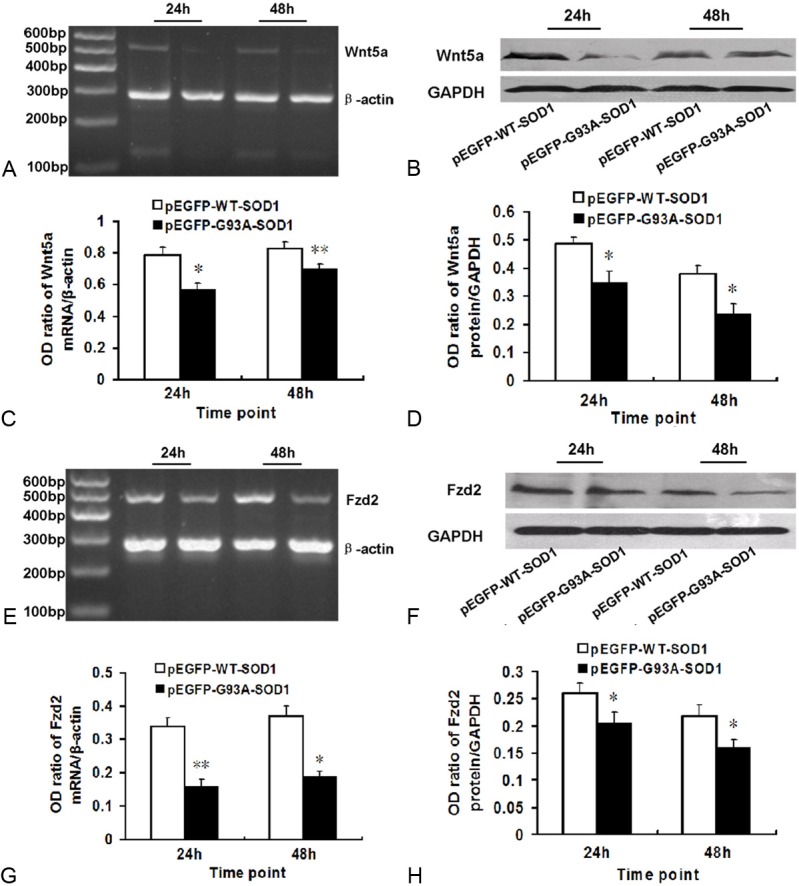
Downregulation of Wnt5a and its receptor Fzd2 in pEGFP-G93A-SOD1 transfected NSC-34 cells, compared with pEGFP-WT-SOD1 transfected NSC-34 cells at 24 and 48 h incubation. A. Gene expression of Wnt5a was lower in pEGFP-G93A-SOD1 transfected cells at both time point than that in pEGFP-WT-SOD1 transfected cells. Beta-actin was used for normalization. B. Representative immunoblot showing that Wnt5a expression was lower in the pEGFP-G93A-SOD1 transfected NSC-34 cells at both time point than that in pEGFP-WT-SOD1 transfected cells. GAPDH was used for normalization. C. Densitometric analysis of RT-PCR results shown in panel (A). Relative amounts of Wnt5a were calculated as the ratio Wnt5a to beta-actin densities (n = 6). D. Densitometric analysis of blot shown in panel (B). Relative amounts of Wnt5a were calculated as the ratio of Wnt5a to GAPDH densities (n = 6). E. Gene expression of Fzd2 was lower in the pEGFP-G93A-SOD1 transfected cells at both time points than that in pEGFP-WT-SOD1 transfected cells. Beta-actin was used for normalization. F. Representative immunoblot showing that Fzd2 expression was lower in the pEGFP-G93A-SOD1 transfected cells at both time point than that in pEGFP-WT-SOD1 transfected cells. GAPDH was used for normalization. G. Densitometric analysis of the RT-PCR results shown in panel (E). Relative amounts of Fzd2 were calculated as the ratio of Wnt5a to beta-actin densities (n = 6). H. Densitometric analysis of the immunoblot shown in panel (F). Relative amounts of Fzd2 were calculated as the ratio Fzd2 to GAPDH densities (n = 6).