
Figure 2.
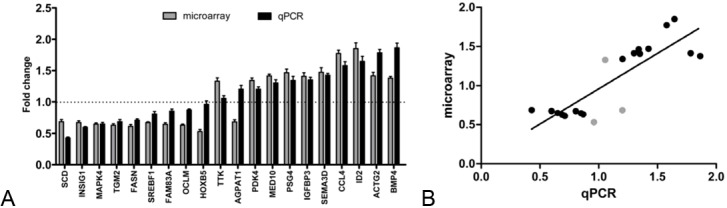
qPCR validation of microarray results. A. Fold changes of 20 gene expression levels following paclitaxel treatment, as determined by microarray and qPCR analysis were shown in histogram. Gene expression was calculated relative to expression of hActb endogenous control and adjusted relative to expression in untreated control cells. Every treatment was triplicate in the same experiment. Error bars represent the standard deviation (SD). B. Correlation of fold change in gene expression levels following paclitaxel treatment as determined by microarray and qPCR. The 3 grey dots represent the 3 genes whose expression treands did not match between microarray data and qPCR results.