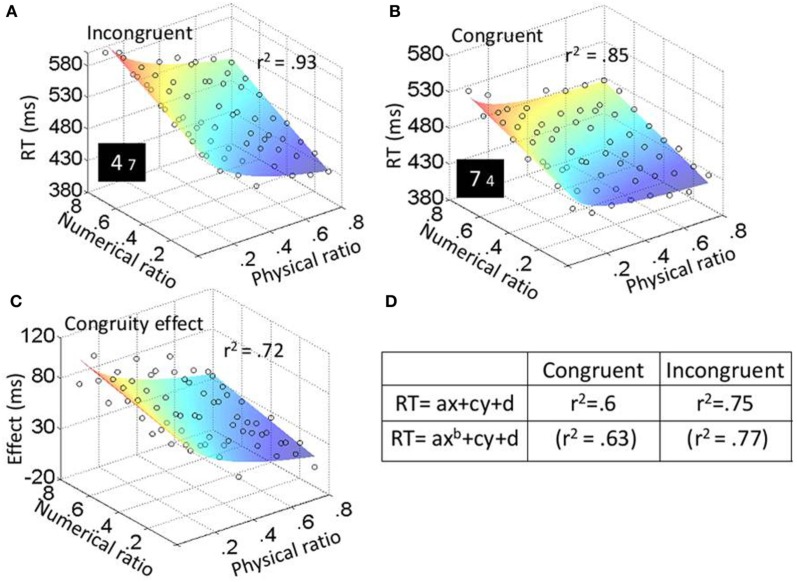
Figure 5.
Experiment 2: numerical task results. Average RT (for every participant in every condition) was plotted as a function of both physical (x-axis) and numerical (y-axis) ratios. The color of the surface represent RTs—blue is for the lowest RTs and red for the highest RTs. Fit values for plots (A), (B), and (C) are higher than the average of the fits based on individual participants. (D) Fits (r2) when fitting the plots of the different conditions to function (1) or function (2).

