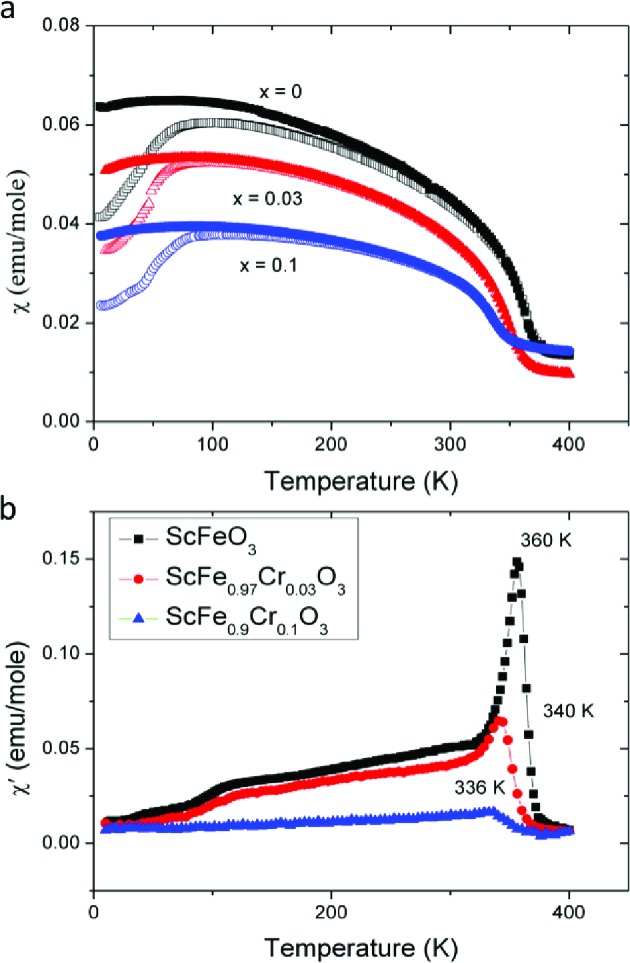
Figure 10.

(a) Temperature dependence of the ZFC and FC dc magnetic susceptibility of ScFe1–xCrxO3 (x = 0, 0.03, and 0.10), measured at 1000 Oe. Open and closed symbols represent ZFC and FC data, respectively. (b) Temperature dependence of the real part of the ac susceptibility of ScFe1–xCrxO3 (x = 0, 0.03, and 0.10), measured at 5 Oe.
