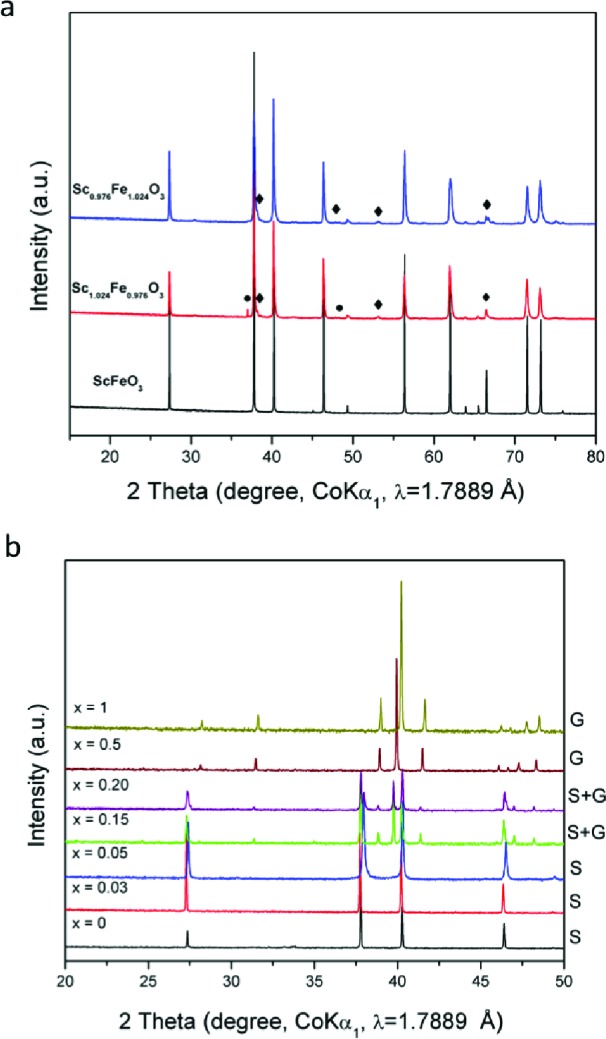
Figure 2.

(a) Room temperature XRD patterns for Sc1–xFe1+xO3 (x = 0, ±0.024). Diamonds represent peaks for corundum impurities and dots bixbyite. (b) Room temperature XRD patterns for ScFe1–xCrxO3 (x = 0, 0.03, 0.10, 0.15, 0.20, 0.50, and 1). The resulting phases for each composition are marked on the right side, where S stands for a high pressure ScFeO3-type phase and G for a GdFeO3-type phase.
