
Figure 4.
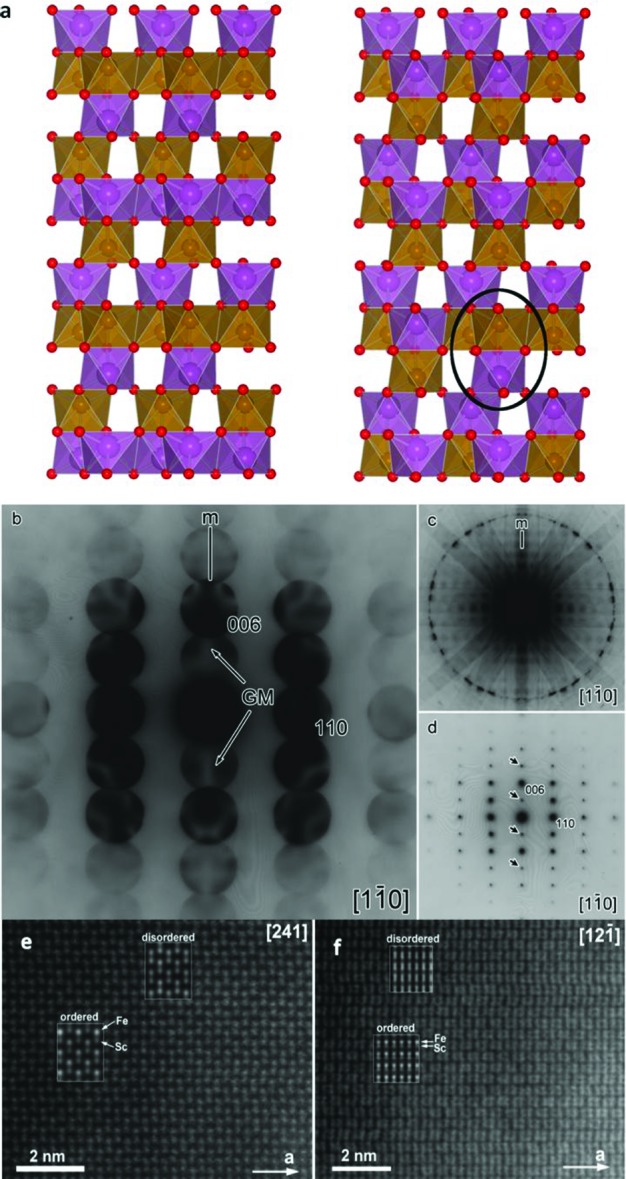
(a) Polyhedral representation of SFO slabs demonstrating the cation order in ilmenite (left) and LiNbO3 (right). The black circle indicates an antisite dimer defect in polar corundum SFO. (b) [11̅0] zone axis noncentrosymmetric CBED pattern. A mirror plane and two GjonnesMoodie (GM) lines parallel to it are highlighted which correspond to the c glide plane. (c) The whole [11̅0] zone axis CBED pattern showing a mirror plane. The five CBED patterns shown here and in Supporting Information Figure S5 are all collected from different crystallites. (d) TEM SAED along the [11̅0] zone axis—the spots due to double diffraction are marked by arrows. (e) [241] = ⟨100⟩p zone axis HAADF-STEM image of ScFeO3. (f) [121̅] = ⟨110⟩p zone axis HAADF-STEM image of ScFeO3. The calculated images for the ordered and disordered structure models are superimposed.