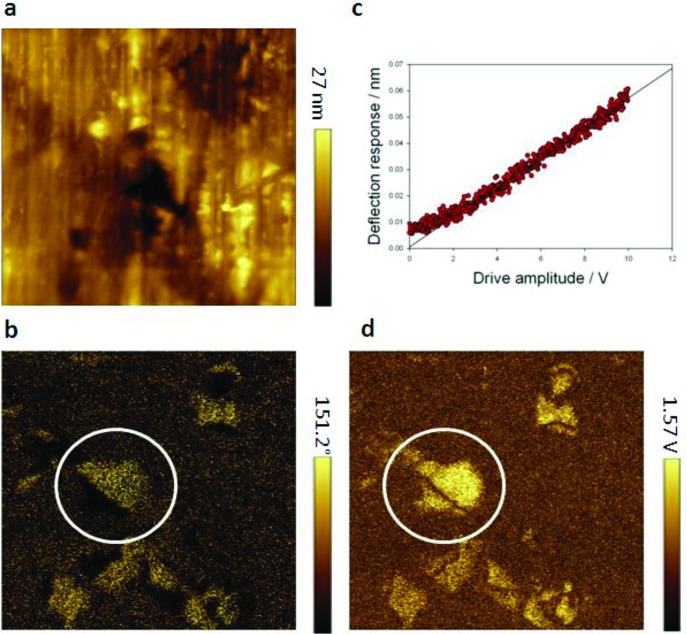
Figure 7.
Piezoresponse force microscopy of ScFeO3. (a) Topography. (b) Vertical PFM phase. (c) Point spectroscopy of the vertical piezoresponse amplitude as a function of ac drive amplitude. (d) Vertical PFM amplitude. PFM images a,b, and d were measured on a ceramic sample; PFM spectroscopy c was measured on a thin film sample. White circles highlight two domains of equal amplitude but opposite phase and are separated by a domain wall of zero amplitude.

