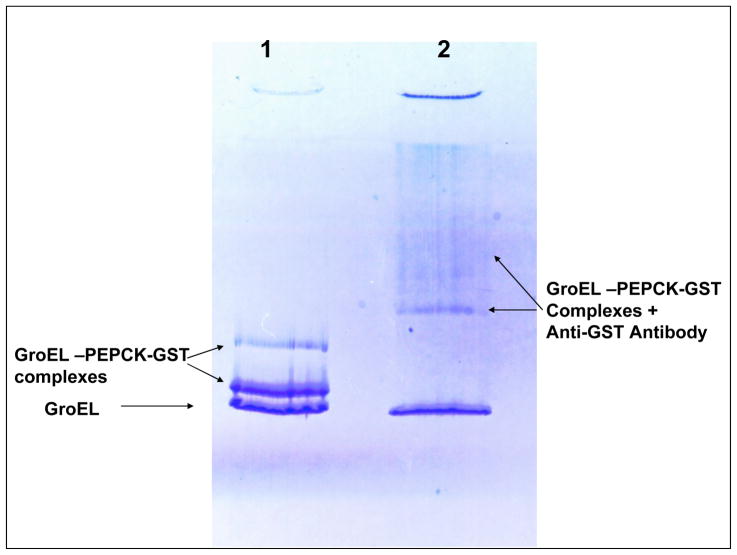
Figure 1.
Lane 1-Native gel depicts fractions containing GroEL and GroEL-PEPCK-GST complexes eluted from glutathione column. GroEL appears in three bands. Two upper Bands contain GST-PEPCK. The lowest band corresponds to free GroEL. Lane 2 examines consequences of a antibody induced shift in molecular mass that results when Monoclonal antibodies to GST are added to the GroEL-PEPCK-GST samples before they are run on the native gel. (upper band GroEL-PEPCK-GST shifts to higher molecular masses (lone arrow upper right and resulting upper smear).

