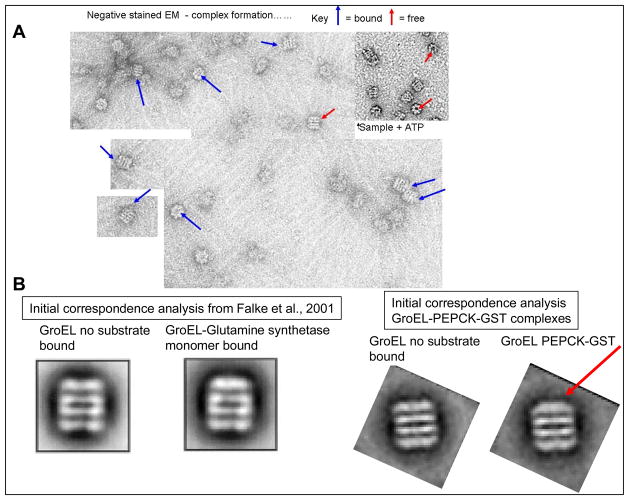
Figure 2.
Negative stain EM Field: GroEL complexes A) Electron Micrograph of the PEPCK-GST sample eluted with glutathione clearly shows the presence of GroEL and additional density at the protein substrate binding site.. Inset: GroEL after treatment with ATP removes the complexed protein. B) Initial correspondence analysis of negatively stained GroEL-glutamine synthetase samples (20,21) revealing uncomplexed GroEL and GroEL complexed with protein is compared with a similar analysis from the current study showing uncomplexed GroEL and GroEL complexed with protein, presumed to be GroEL-PEPCK-GST. Arrow points to area of increased electron density in current study. For GroEL-PEPCK-GST, the distribution of images in a typical population was ~ 60% free, 40% bound) see methods for more details).

