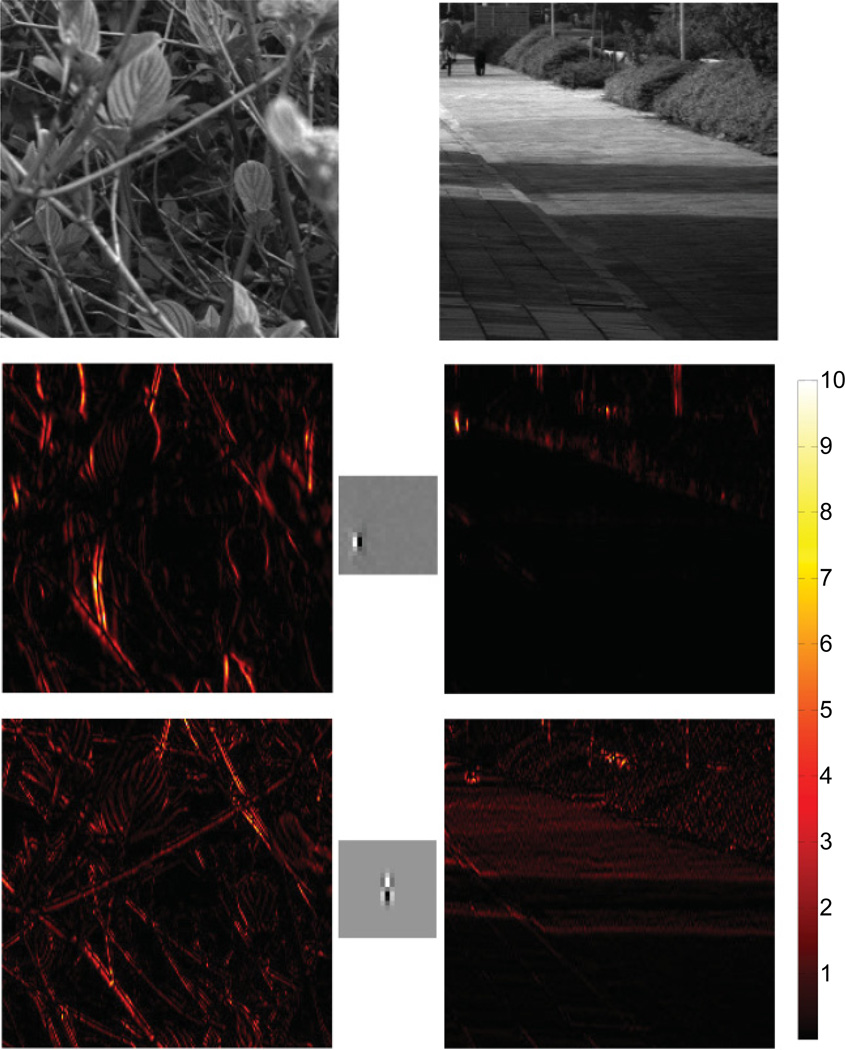
Figure 15.
Two examples of 230 × 230 patches from the van Hateren database and their convolution transformation by a Gabor and a double-Gabor filter with similar orientation prefereances. The 21 × 21 Gabor and double-Gabor filters (scaled up by a factor of three here) are shown in the middle and the bottom rows, respectively. Their corresponding transformed images were obtained by squaring each pixel after the convolution transformation of the images on the top with the filters shown. The convoluted images are 210 × 210 due to edges. The squaring better illustrates the edge and texture energy.

