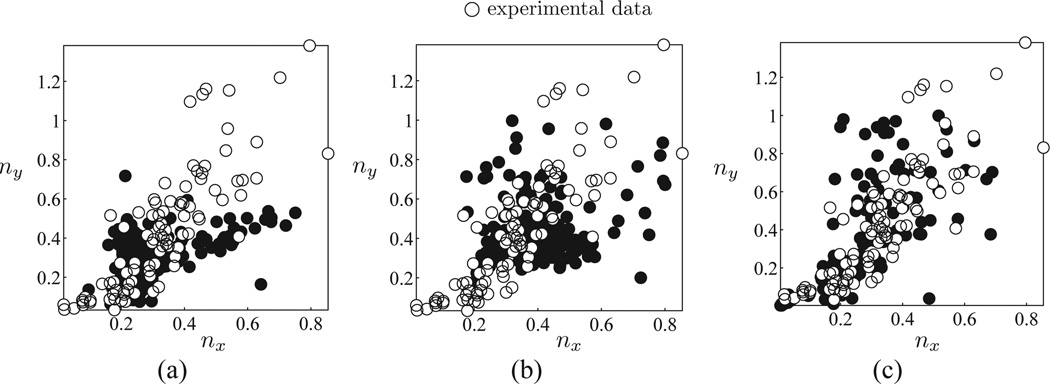
Figure 16.
Normalized spatial fequency plot of the experimental results (empty circles) and different versions of ICA filters (filled circles), where nx = kx/(2πγx), ny = kx/(2πγy). Each empty circle represents measurements from a single cortical neuron. The experimental results are reproduced here with permission from Ringach (Ringach, 2004; Ringach, Hawken, & Shapely, 2003). nx(y) is a dimensionless measure of the spread of Gabor-fit filters in x′ (y′) direction in units of the underlying wavelength of the modulations. (a) Filled circles are standard ICA results. (b) The same plot as a but the filled circles are now obtained by Gabor fit to the translation-invariant ICA results. (c) Here the filled circles are obtained from the double-Gabor fits. In all panels, the ICA fits are scaled by one-half to roughly match the experimental bounds. The failure of the standard ICA results (see panel a) in capturing the clustering of (nx, ny) along a line is now replaced with a better fit of the translation-invariant ICA in panels b and c.

