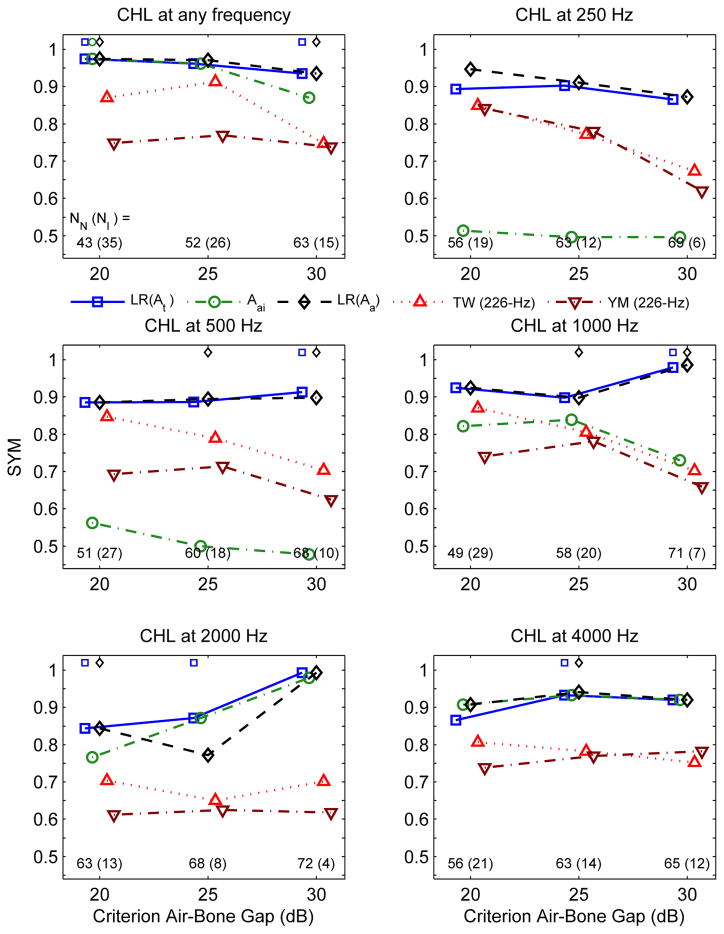
Figure 4.
SYM is plotted for each predictor of a CHL at any frequency at which a CHL is present (upper left panel) and at each frequency of CHL (remaining five panels) as a function of the criterion ABG level (in dB) used to define the CHL. The formats of the SYM plots, the numbers of test ears and the significant differences in SYM are the same as the corresponding formats of the AUC plots in Fig. 3.

