
Figure 3. Breadth of immune responses.
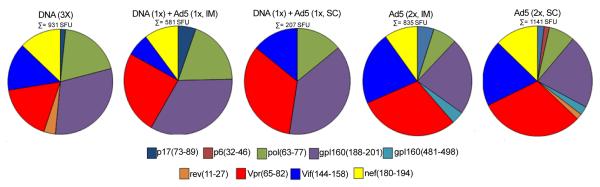
BALB/c mice were immunized as described in Figure 1 and Methods section. Two weeks after the last immunization, splenocytes from immunized mice (6 per group) were pooled and the specific IFN-γ responses were evaluated in vitro against 18 individual HIV-1 peptides encoded by the vaccines (5μM). The pie charts show the frequencies of HIV-1 peptide-specific IFN-γ secreting cells by displaying each number of SFU/106 cells for each positive peptide as a proportion of the sum of SFU/106 cells for all positive peptides. The sum of all positive responses (SFU/106 cells) is shown above each pie chart. Splenocytes from control groups (pVAX1 and/or Ad5-βgal) presented negligible numbers of IFN-γ secreting cells after stimulation with each of the 18 encoded peptides. SFU, spot-forming units. Cutoff: 15 SFU/106.