
Figure 2.
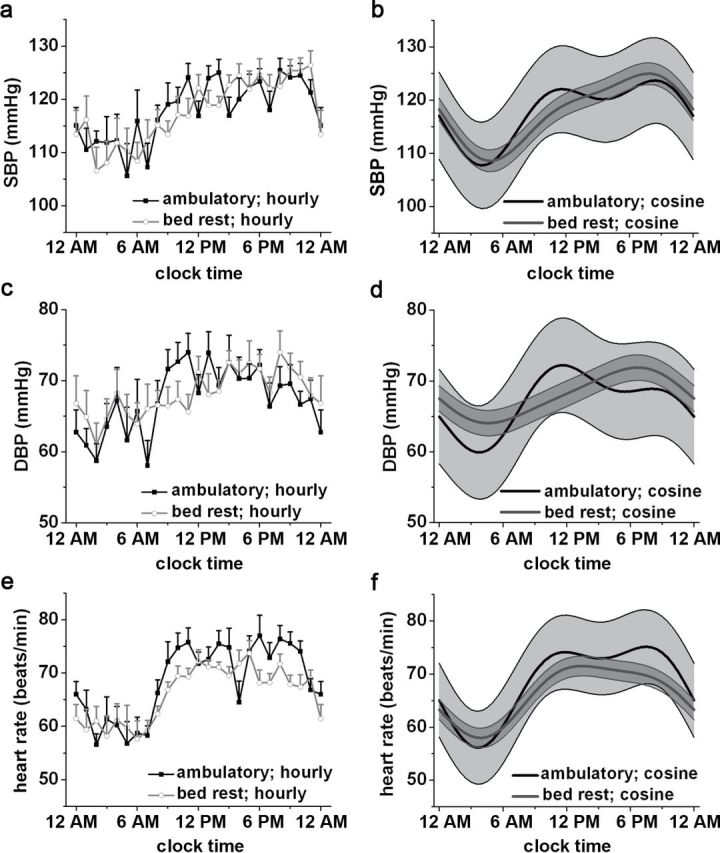
Twenty-four-hour blood pressure and heart rate profiles under ambulatory and bed rest conditions. (a and b) Systolic blood pressure (SBP) data. (c and d) Diastolic blood pressure (DBP) data. (e and f) Heart rate data. (a, c, e) Hourly plots of data (mean ± SEM). (b, d, f) Cosinor fits (mean ± 95% confidence interval). See text for P values.