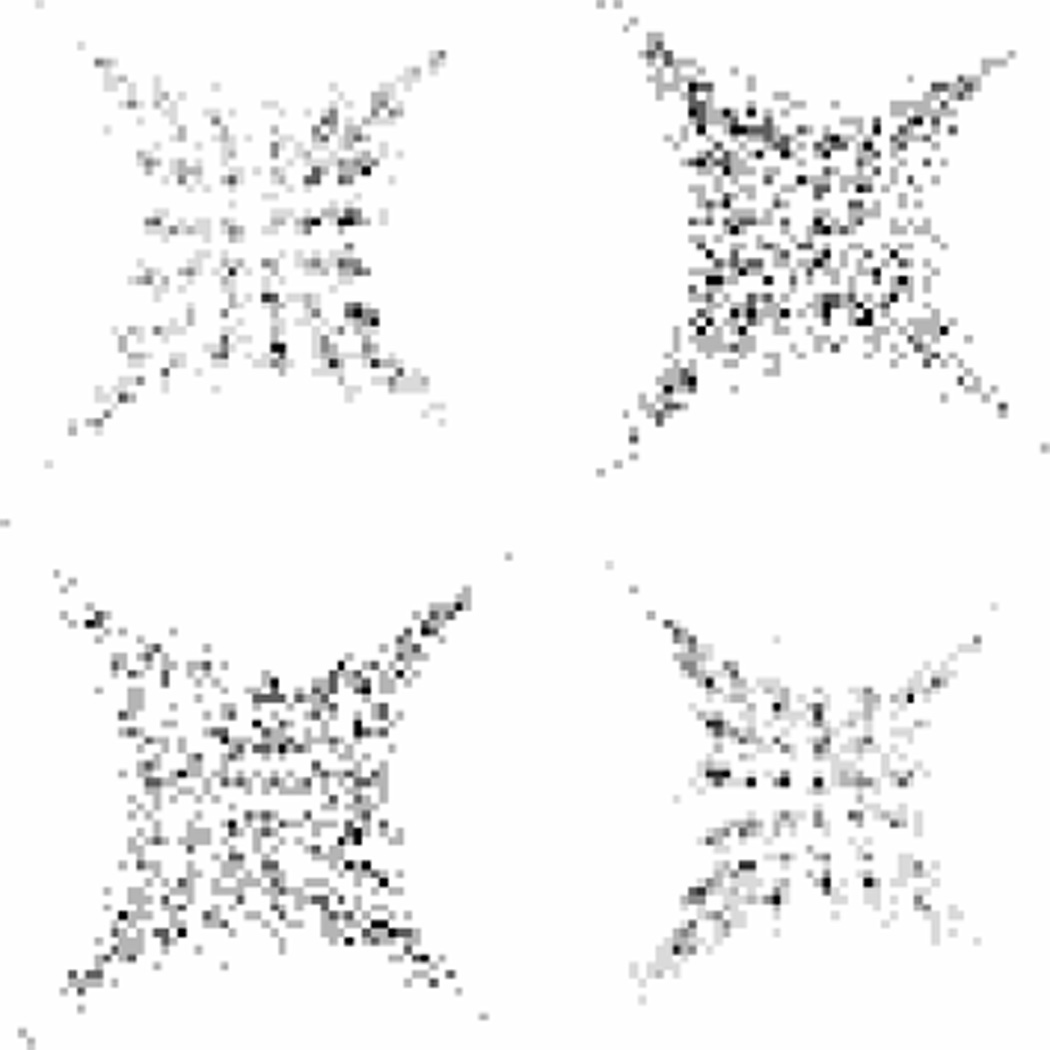
Fig. 17.
The top two images show the resulting crystal flood histograms in each of the two opposing detectors (Fig. 7) when events are gated around the negative side lobe from the coincidence time histogram of Fig. 16. Individual crystals are visible in the left crystal array, but blurred in the right crystal array. The bottom two images show that for gating around the positive side lobe, where the reverse is true. These data indicate that the side lobes are the result of multiple interactions in a single array.

