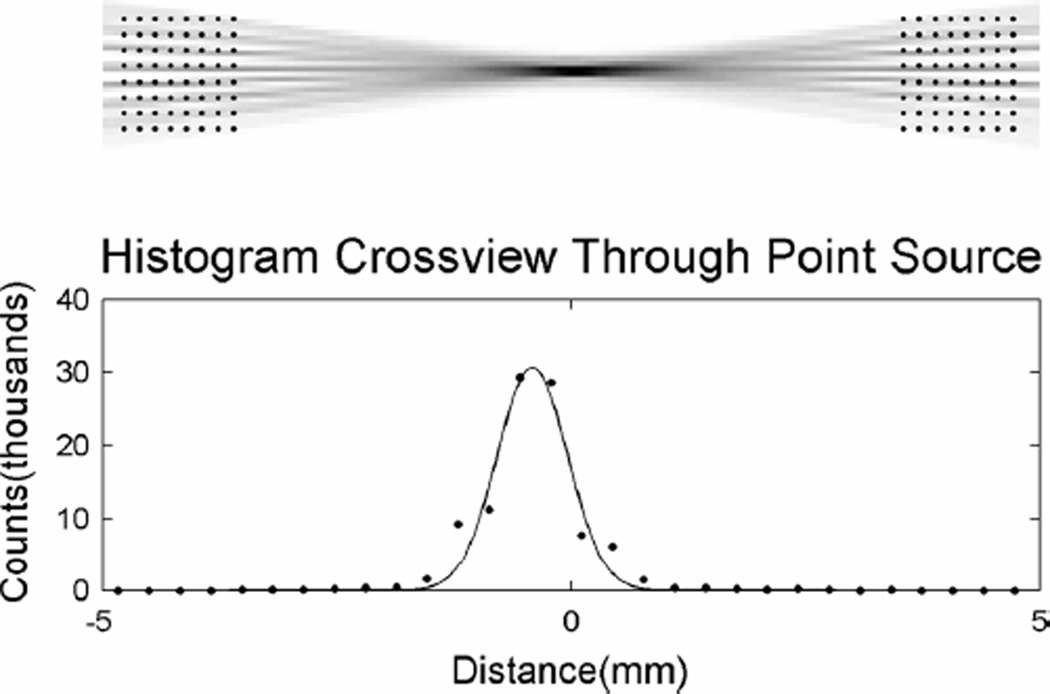
Fig. 18.
Histograms of the backprojected lines of response from the coincidence data with a 0.250-mm-diameter point source with a 0.33 mm pixel/bin size. The bottom plot is a histogram of the lines of response taken from a vertical profile through the center of the image. The raw FWHM is 0.90±0.05 mm (before beam size deconvolution).

