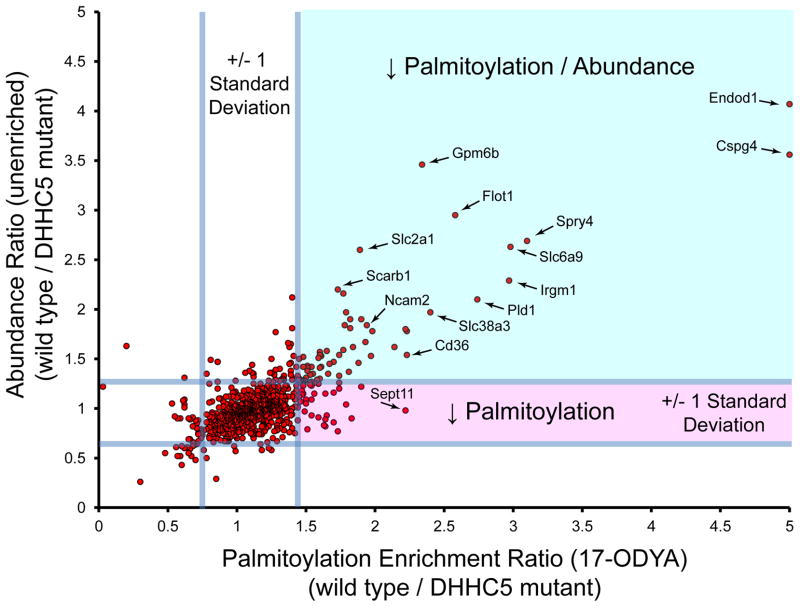
Figure 3.
Profiling DHHC5 substrates by quantitative proteomics. SILAC labeled wild type and DHHC5 mutant neuronal stem cells were profiled directly by unenriched proteomics or after 17-ODYA enrichment [48]. Median SILAC ratios of validated palmitoylated proteins observed in both experiments are shown with reference lines signifying 2 standard deviations centered at the mean. The unenriched proteomics experiment is more complex, and hence many palmitoylated proteins were not detected and therefore not shown. Ratios <5 are displayed, which excludes several proteins, including Gjc2, Mydam, Gstk1, and Glb1. Proteins displayed in the upper right quadrant (green shading) display reduced abundance, which corresponds to reduced 17-ODYA enrichment. Essentially no proteins show a singular reduction in palmitoylation (lower right quadrant, red shading) without a corresponding drop in abundance. These results highlight difficulties in direct annotation of DHHC substrates by proteomic approaches.

