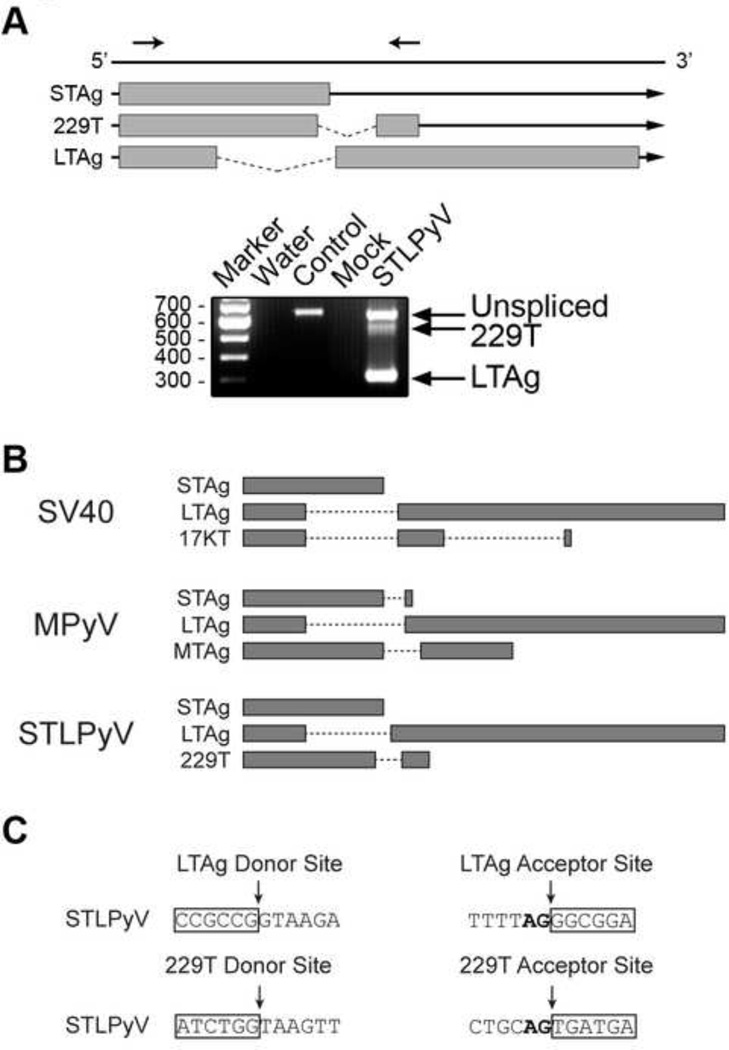
Figure 2. Alternative splicing of STLPyV early region.
(A) Schematic shows mRNA transcripts expressed from the early region of STLPyV. Exonic regions are indicated by grey boxes, intronic regions by lines. Arrows above the diagram indicate the position of primers. 293T cells were transfected with a plasmid expressing STLPyV LTAg for 48 hr. Cells were harvested and lysed for RT-PCR analysis. RT-PCR reactions were performed with water (Water), STLPyV LTAg plasmid (Control), RNA harvested from mock-transfected (Mock), STLPyV LTAg transfected 293T cells (STLPyV). Data are representative of at least three independent experiments. The three alternatively splice mRNA transcripts were confirmed with a different set of primers (data not shown) and verified in HeLa cells (data not shown). (B) Diagram showing the coding region of T antigens, separated by intron regions in dashed lines. The T’- and truncated T antigens of JCPyV and BKPyV are spliced from LTAg transcripts in a similar manner as SV40 17KT. (C) Sequences of the splice donor and acceptor sites for STLPyV LTAg and 229T transcripts (strain MA138). Exon sequences are highlighted in boxes. The nucleotide sequences of the splice donor and acceptor sites of STLPyV shown are conserved in the three STLPyV strains characterized.

