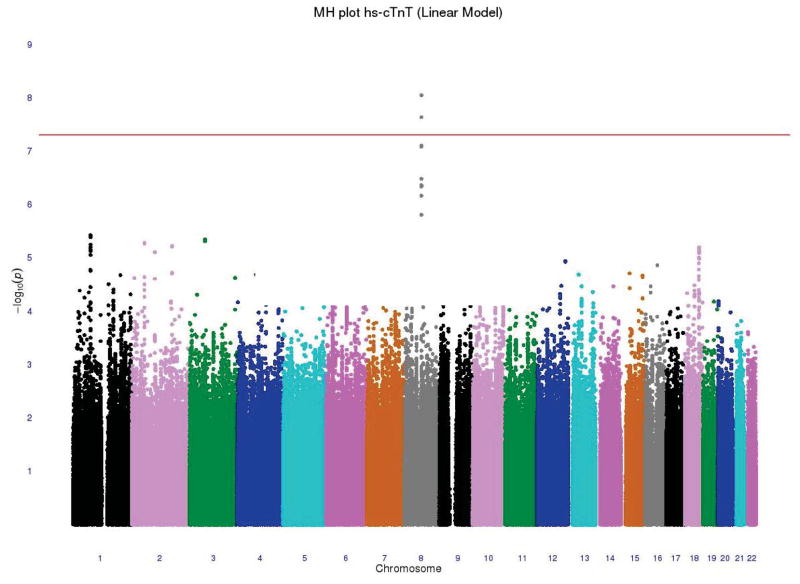
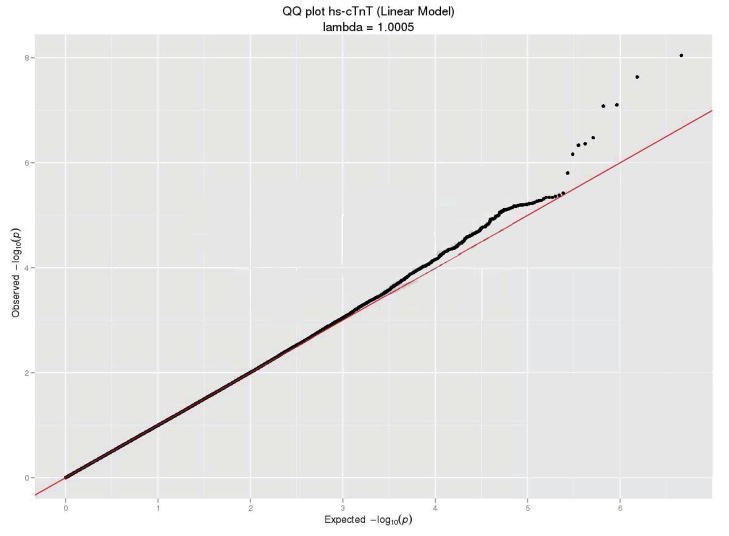
Figure 1.
(A) −log10 p-value of an additive genetic model for each SNP according to its location in the 22 autosomal chromosomes from the two-stage meta-analysis (linear analysis). Horizontal line indicates the a priori 5 × 10⁻⁸ threshold of genome-wide significance. (B) Plot of the expected and observed −log p-values from the two-stage meta-analysis


