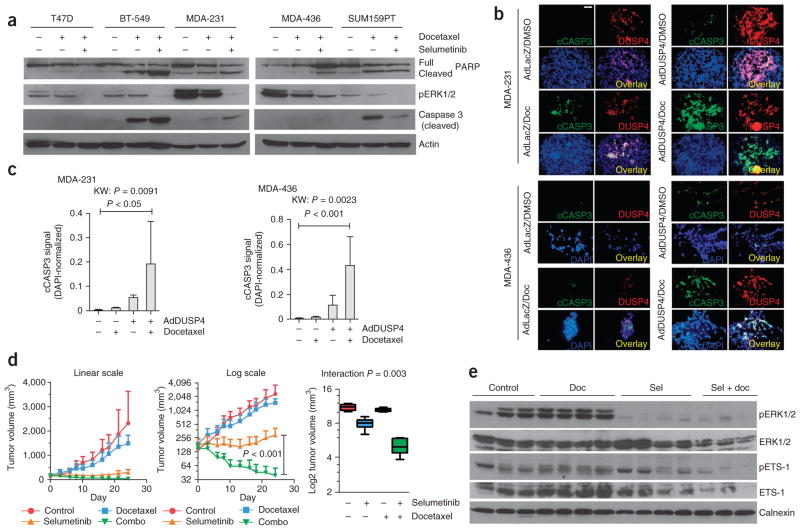
Figure 6.
Pharmacological or genetic inhibition of MEK improves chemotherapy-induced apoptosis in vitro and in vivo. (a) Immunoblot analysis of breast cancer cell lines treated for 6 h with docetaxel or DMSO in normal growth medium, followed by drug washout and treatment with DMSO or selumetinib for 72 h. (b) Immunofluorescence for cleaved caspase 3 and DUSP4 in MDA-231 and MDA-436 cells transduced with adenovirus encoding DUSP4 (AdDUSP4) or LacZ (AdLacZ, control) followed by 24 h of docetaxel (Doc) or DMSO treatment. DUSP4 is shown in red, cleaved caspase 3 (cCASP3) is shown in green, and DAPI is shown in blue. The overlay (yellow) is shown in the lower right quadrant of each group. Scale bar, 50 μm. (c) Quantification of the immunofluorescence in b. FITC (cleaved caspase 3) signals were normalized to DAPI and are shown as mean ± s.d. (n = 5). The Kruskal-Wallis (nonparametric ANOVA equivalent; KW) test was used to test for differences among the groups, with a Dunn’s post-test to compare individual groups. (d) Tumor growth curves of MDA-231 xenografts randomized to treatment with selumetinib, docetaxel, the combination of both (combo) or vehicle control (n = 9 per arm). The results are shown on the linear scale (left) and the log2 scale (center) to visualize the differences in smaller tumors. Boxplot of final tumor volumes (day 24, right). The treatment interaction was tested by two-way ANOVA. Data are mean ± range. (e) Immunoblot analysis of xenografts harvested after 3 d of treatment, 1 h after the last dose of selumetinib (Sel).

