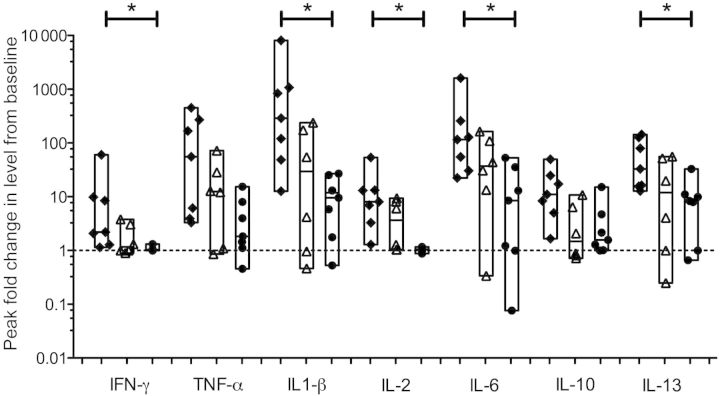
Figure 4.
Peak fold change from baseline in levels of selected cytokines. To correct for the variability in levels of cytokines and chemokines observed at baseline (study day 0), the peak level of each analyte for each subject was compared to the value measured at baseline. Results are expressed as fold change over baseline (dotted line). For each cytokine, the black diamonds represent data from group 1, the open triangles represent data from group 2, and the black circles represent data from group 3. The floating bars represent the range from minimum to maximum values; the median values for each subject are shown. Asterisks indicate a P value of ≤ .007 for the difference between group 1 and group 3. Abbreviations: IFN-γ, interferon γ; IL, interleukin; TNF-α, tumor necrosis factor α.

