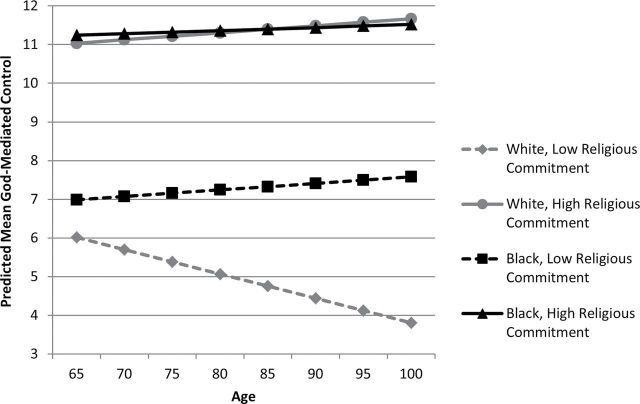
Figure 2.
Illustration of race by religious commitment interaction effect on predicted mean age–related trajectories of change in God-mediated control. Plots for high and low religious commitment assume minimum (3) and maximum (12) scores on the religious commitment scale. Values of all other model variables are held constant at their grand means.

