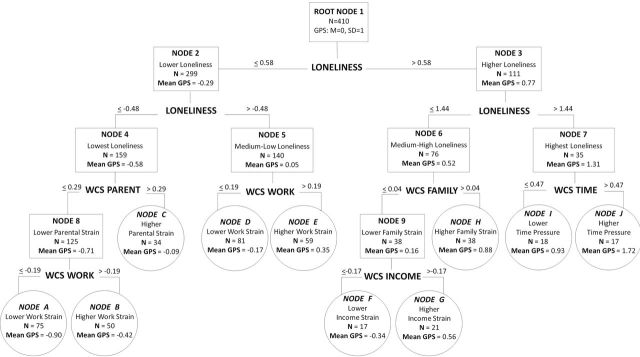
Figure 1.

Perceived stress regression tree. Root and child nodes are displayed in boxes; terminal nodes are displayed in circles. Splitting variables are indicated at the intersection of branching lines. For each node, cut point on the splitting variable, number of participants in that node, and perceived stress mean and standard deviation are reported. GPS = Global Perceived Stress outcome, measured by the Perceived Stress Scale; WCS PARENT = Wheaton Chronic Stress Scale parent role; WCS WORK = Wheaton Chronic Stress Scale work role; WCS FAMILY = Wheaton Chronic Stress Scale family role; WCS INCOME = Wheaton Chronic Stress Scale financial strain; WCS TIME = Wheaton Chronic Stress Scale time/pressure.
