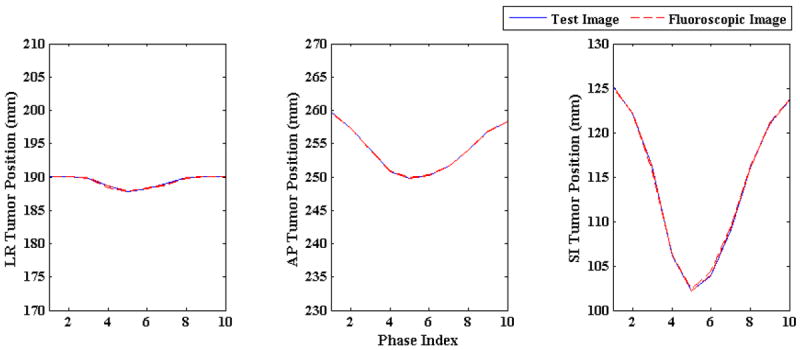
Figure 11.

Tumor centroid positions in ground truth 3D images (solid blue line) vs. tumor trajectories in generated 3D fluoroscopic images (broken red line) for low and high imaging noise The tumor trajectory in generated 3D fluoroscopic images closely follow the tumor trajectory in test images in LR, AP, and SI directions. The tumor trajectories in reconstructed 3D fluoroscopic images overlap each other which shows the robustness of model to different imaging noises
