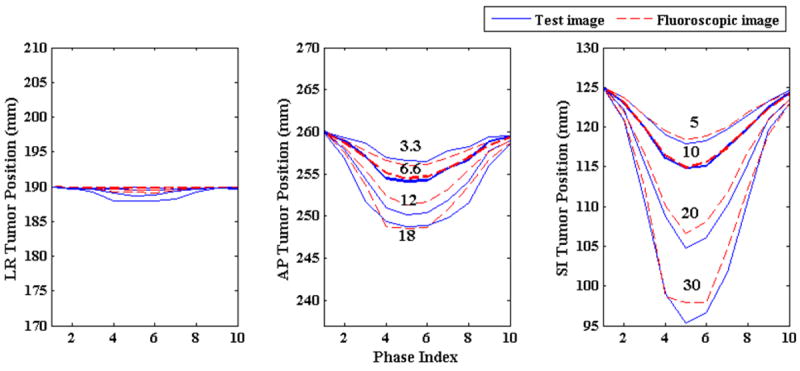
Figure 4.

Tumor centroid positions in ground truth 3D image (solid blue line) vs. tumor positions in generated 3D fluoroscopic images (broken red line) with changing diaphragm and chest wall motion amplitudes. The numbers in the middle and right plots represent magnitude of chest wall (middle) and diaphragm (right) motions in mm for the adjacent solid blue lines. In all three directions tumor centroid positions in the generated 3D fluoroscopic images match tumor positions in the ground truth 3D images very closely. There is a small loss in tumor localization accuracy as the amplitudes vary.
