
Figure 6.
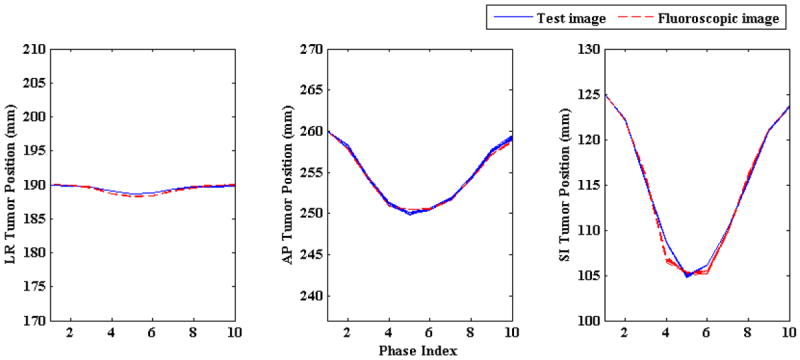
Tumor centroid positions in ground truth test images (solid blue line) vs. tumor centroid positions in generated 3D fluoroscopic images (broken red line) with changing breathing period. Irrespective of changing breathing period broken red lines are closely followed by solid blue lines in all three LR, AP, and SI directions. Tumor trajectories for different breathing periods overlap each other as the magnitudes of AP and SI directions were kept constant while the breathing period was changed (hence “thicker” solid blue and broken red lines).