
Figure 7.
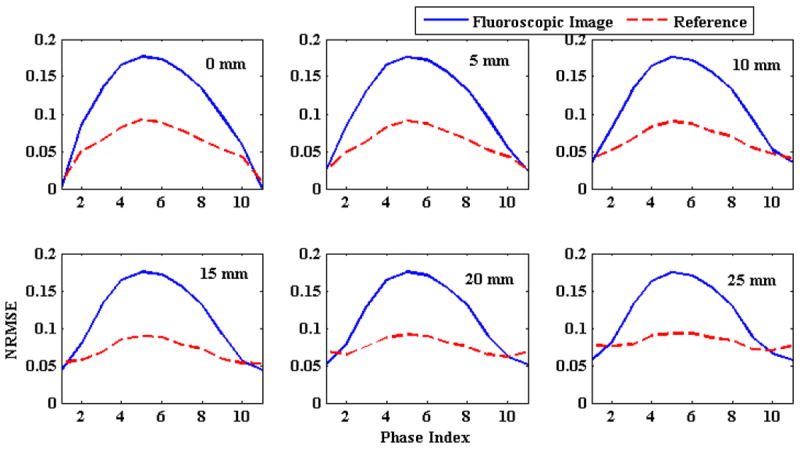
Comparison of NRMSE errors with shifting baseline. Solid blue lines represent initial NRMSE and broken red lines represent final NRMSE. The number in the upper right corner of each plot shows the baseline shift introduced in the SI direction.