
Fig. 5.
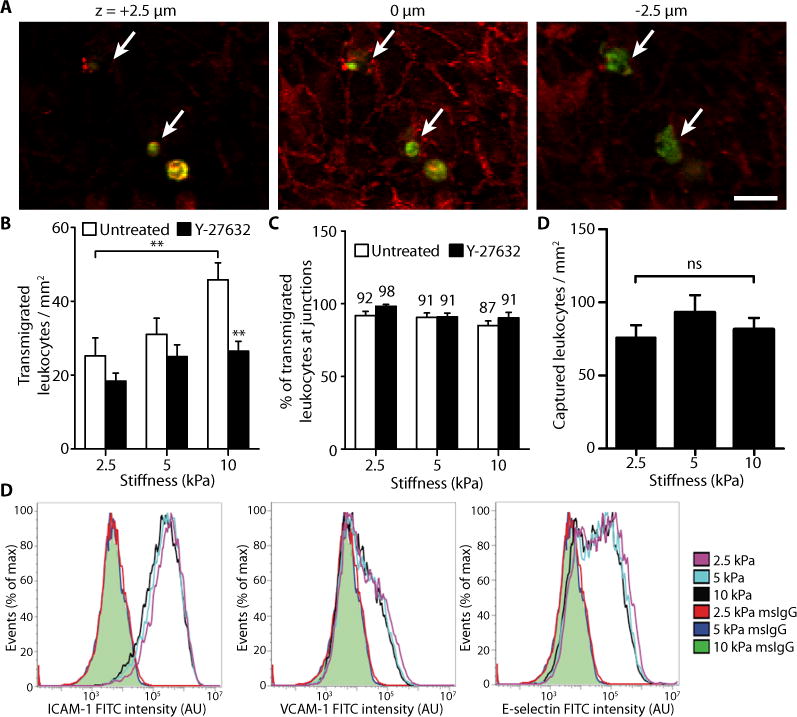
Matrix stiffness enhances leukocyte transmigration. (A) Representative fluorescent images of leukocytes (green) transmigrating through an endothelial monolayer (VE-cadherin, red). Images were taken at focal planes above the monolayer (+2.5 μm), at the monolayer (0 μm), and below the monolayer (−2.5 μm). Arrows indicate transmigrated cells. Scale bar, 20 μm. (B) Histogram showing the effect of matrix stiffness on the number of transmigrated leukocytes. Endothelial cells were either untreated (n = 19 fields of view, three independent experiments) or pre-treated with Y-27632 (n = 17–18 fields of view). Data are means ± SEM. **P < 0.01 (Tukey’s test) compared to respective untreated condition, unless otherwise indicated by brackets. (C) Percentage of leukocytes that transmigrated through intercellular junctions. Numbers above bars indicate the nominal values. Data are means ± SEM. (D) The effect of substrate stiffness on the number of captured leukocytes. Data are means ± SEM (n = 79 to 96 fields of view per stiffness). ns, not significant (Tukey’s test). (E) Flow cytometry analysis of HUVEC expression of ICAM-1, VCAM-1, and E-selectin on gels after a 6-h treatment with TNF-α. Shaded green curves represent overlapping mouse IgG isotype controls (msIgG) for each of the three matrices. Three independent experiments were performed. No statistically significant differences (Tukey’s test) were found between the three stiffnesses for all three adhesion molecules.