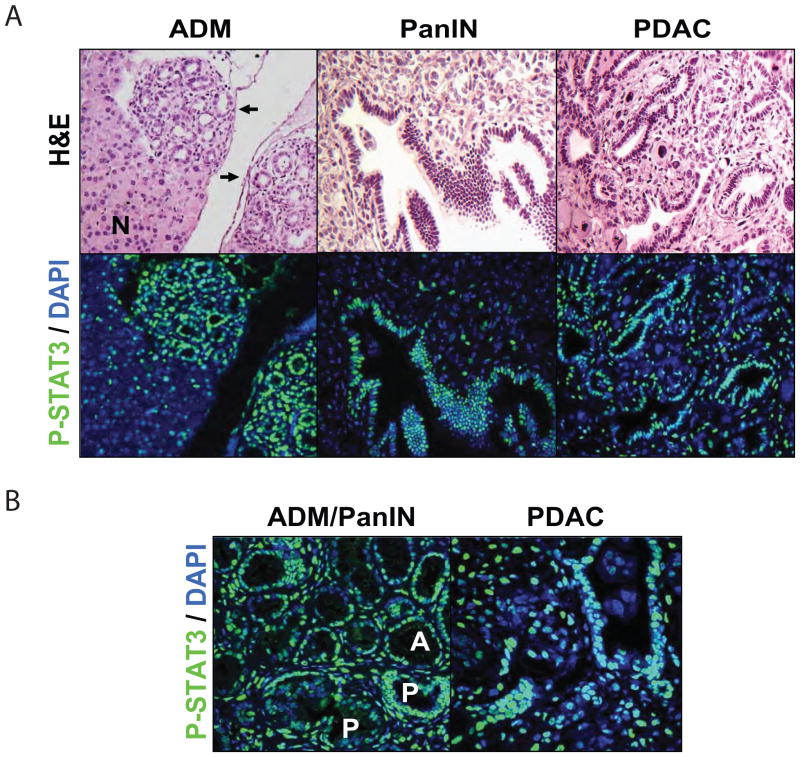
Fig. 3. STAT3 is phosphorylated at multiple stages of pancreatic tumorigenesis.
A, ADM and late-stage PanIN tissue from Pdx1-Cre; LSL-KRASG12D mice and PDAC tissue from Pdx1-Cre; LSL-KRASG12D; p53+/− mice were analyzed for the presence of P-STAT3 (green) by immunofluoresence with DAPI nuclear counterstain (blue). After image capture, slides were stained with hematoxylin and eosin (H&E). Arrows indicate regions of ADM. Normal pancreas is indicated by (N). B, higher magnification images of P-STAT3 staining (green) in ADM (upper half of image, A) or early-stage PanIN (lower half of image, P) lesions or in PDAC are shown.

