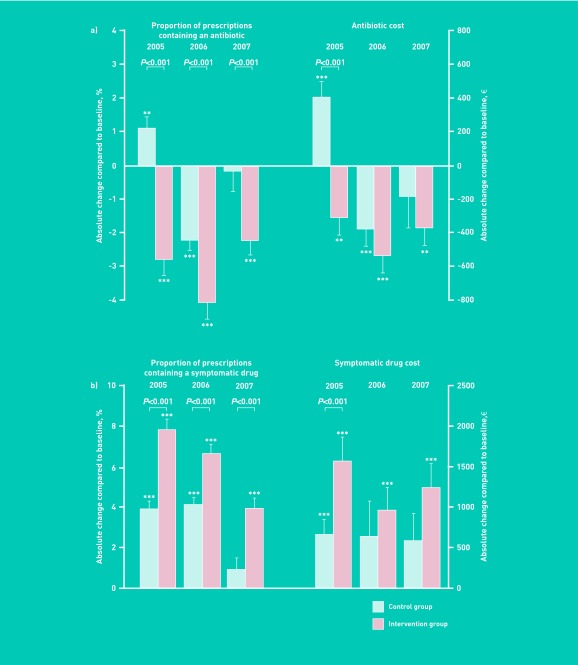
Figure 2.
Effects of an educational meeting on GP prescriptions. Absolute change from 2005 to 2007 compared to baseline in (a) proportion of prescriptions containing an antibiotic and related cost and (b) proportion of prescriptions containing a symptomatic drug and related cost. Data are expressed as mean ± SEM. Asterisks indicate the level of statistical significance for intra-group comparisons (compared to baseline) (*P<0.05, **P<0.01, ***P<0.001). P-values represent between-group differences (control group versus intervention).

