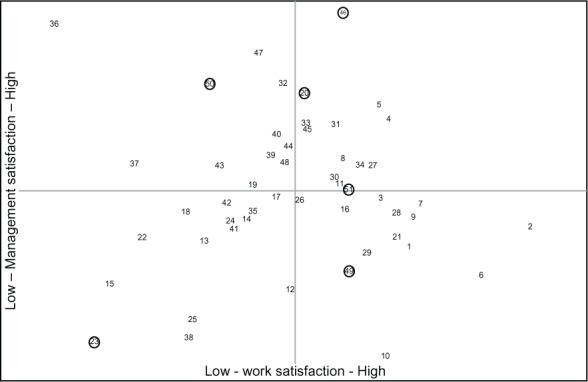
Figure 2.

Scatter plot of different departments, indicated by the numbers, on work and management satisfaction, resulting from the satisfaction survey analysis.
Notes: The upper half represents high management satisfaction, the right half corresponds to high work satisfaction. Interviewed departments are circled.
