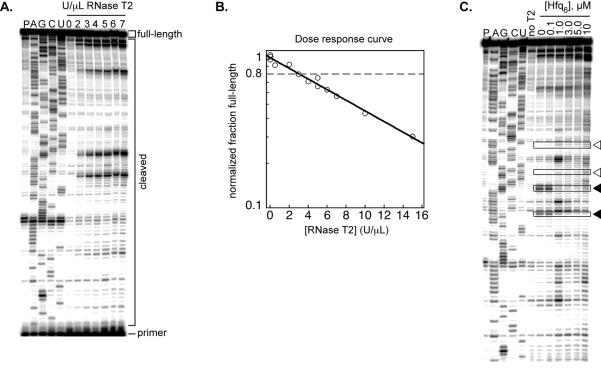
Figure 2. RNase T2 footprinting of Hfq•rpoS complex.
A) Representative sequencing gel showing the RNase T2 dose response for the rpoS mRNA leader. An RNA-only pausing control (P) is followed by ddNTP generated sequencing lanes (A,G,C, and U). The next seven lanes are folded rpoS RNA reacted for one minute with increasing concentration (U/μL) of RNase T2. The positions of cDNAs generated from the full-length or cleaved RNAs, as well as the primer, are indicated. B) Semi-log plot of the dose response, calculated by dividing the counts in the full-length band by the total counts in the cleaved bands, omitting the primer. Full-length percentages are normalized to the zero RNase T2 lane. The data are fit with an exponential decay function. The RNase concentration that gives ~80% full-length (dashed line) is used in future experiments. C) Footprinting Hfq on the rpoS leader. Folded rpoS RNA is incubated with increasing concentrations of Hfq hexamer for 5–10 minutes then reacted with 3 U/μL RNase T2 for one minute. Boxed bands indicate representative nucleotides that are protected (filled triangles) or deprotected (empty triangles) with increasing Hfq6.

