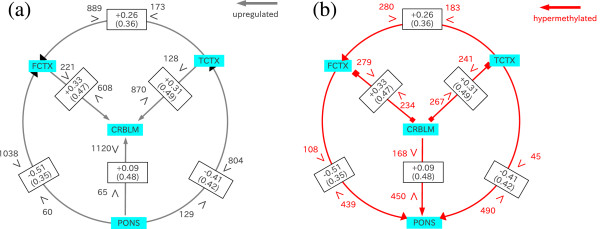
Figure 1.

Schematic illustration of the relationship between miRNA-mediated gene regulation and miRNA-targeted-specific promoter methylation. Arrows/segments indicate up/downregulation of miRNA target genes (a) and miRNA-targeted-specific promoter methylation (b). Black (red) numbers next to inequality signs are the averaged number of miRNAs whose target genes are significantly up/downregulated (whose target genes promoters are hyper/hypomethylated). TCTX refers to the temporal cortex, FCTX to the frontal cortes, CRBLM to the cerebellum, and PONS to the pons. For example, there are 280 (183) miRNAs whose target gene promoters are significantly hyper(hypo)methylated in FCFX compared to TCTX. Similarly, there are 889 (173) miRNAs whose target genes are significantly up(down)regulated in FCFX compared to TCTX. Since 280 is larger than 183, gene promoters in FCFX are considered to be more hypermethylated than those in TCTX based on the miRNA-centric-view, thus the red arrow directs the reader from TCTX to FCTX. Likewise, because 889 is larger than 173, genes in FCFX are considered to be upregulated when compared to TCTX, thus the black arrow directs the reader from TCTX to FCTX. The numbers in the rectangle indicate Spearman correlation coefficients between miRNA-mediated gene regulation and miRNA-targeted-specific promoter methylation, . Standard deviations of Spearman correlation coefficients, are shown in parentheses.
